Credit Impulse Explained: There are many analysts and investors who believe that the entire ’09-’17 stock rally is nothing more than the result of a historic, globally coordinated credit creation event from the world’s major central banks. Put in layman’s terms, every major central bank in the world has done QE at some stage over the past eight years, and pumped the world full on cash. So, all they’ve done is create massive asset inflation in bonds, stocks and real estate.
Help your clients outperform markets with The Sevens Report—start your free two-week trial today.
 QE is Quantitative easing. It is a “monetary policy in which a central bank creates new electronic money in order to buy government bonds or other financial assets to stimulate the economy (i.e., to increase private-sector spending and return inflation to its target).”
First, the theory goes, it was China’s central bank (the PBOC) and the Fed unleashing the initial wave of QE following the financial crisis in ’08/’09. Both central banks kept their foot on the accelerators over the next several years (remember QE1, QE2, Operation Twist, and then QE Infinity). In 2013, the Bank of Japan joined the Fed, PBOC and Bank of England at the QE party, only they came to really party, and upped the ante by creating a huge QE program.
Then, as the US and Chinese economies showed signs of life (finally) in 2015, the Fed and PBOC paused their QE/credit creation programs. And, whether causally or coincidentally, 2015 turned out to be one of the more volatile years in the markets in the last decade… and US stocks largely traded sideways until early 2016.
But by that point, the ECB had joined the QE party, and the PBOC restarted its credit creation machine following the economic scare of 2H 2015. So, even while the Fed has stopped QE, on a global basis the total amount of QE and credit in the system resumed a steep acceleration, as now the PBOC, BOJ and ECB were doing QE.
Again, coincidentally or causally, stocks broke out in February 2016, and they literally haven’t taken a break in 19 months (excluding two one-night scares with Brexit and the US election).
So, again, while there is no hard proof that this global expansion of credit has powered US (and now global) stocks higher, there certainly is at least a casual relationship if we look at history.
The reason I am pointing this out is simple: There are growing signs that the near-decade-long global credit creation/QE cycle appears to be nearing the end. First, there are the central bank actions. The Fed is hiking rates, and likely taking steps to reduce its balance sheet, draining liquidity from the system.
Second, the ECB appears to be on the verge of tapering its QE program, and while that will still result in a net credit increase for the next year, the pace of credit creation will slow. Finally, and perhaps most importantly, China continues to aggressively reduce credit in its economy, and I’ll again remind everyone the last time they did that, we got the volatility in 2H ’15.
This is where the “Credit Impulse” comes in.
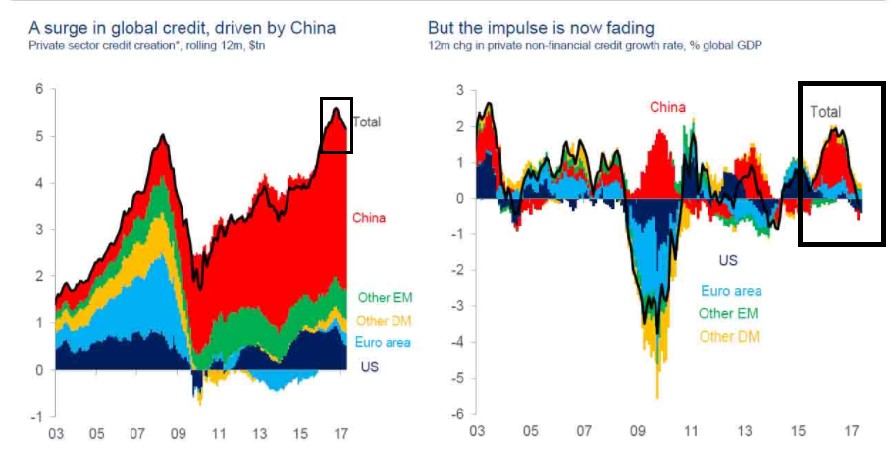
Credit Impulse is a term used by various research firms that measures the “Rate of Change of Change” of global credit creation/QE. Put simply, while the global amount of credit may still be rising, the pace of the increase has not only slowed… it’s turned negative. Similar to taking your foot off the gas while you’re still going forward. It’s just a matter of time until you stop.
Getting more granular, UBS has been out front on this issue, and back in February noted that Credit Impulse turned negative. In a much-anticipated report out last week, the firm said that the decline over the past three-to-four months has accelerated, with Credit Impulse dropping to -0.6% annualized over the past three months.
Now, Credit Impulse is a composite of various measures of credit, including loans, loan demand and other metrics, so this is not a hard-and-fast number. And the fact that it has turned negative doesn’t mean we’re looking at an impending collapse in stocks.
But if we look at the entire picture, negative Credit Impulse; a more-hawkish-than-expected Fed that’s apparently committed to reducing its balance sheet, a Chinese central bank that is apparently committed to reducing credit in that economy, and an ECB that will begin tapering QE in 2018… the fact is we appear to be nearing the end of the post-financial-crisis credit expansion, and with economic growth where it is, I cannot see how that will be positive for stocks longer term.
Bottom line, I’m not turning into ZeroHedge (although they are all over this), but the fact is that I sense a lot of complacence regarding the end of this global credit creation cycle.
People seem to think that because the Fed ended QE and hiked rates, and then nothing “bad” happened, that this means things will be ok. The only problem is they fail to consider that at the exact time the Fed stopped QE, the BOJ, ECB and PBOC all ramped up their QE programs. That means global liquidity continued to expand, and stocks and Treasuries have been the massive beneficiary.
So, there’s what keeps me up at night, i.e., what happens in 12 months if the only central bank still doing QE is the BOJ? Maybe nothing, but I can’t be sure, especially considering current economic growth.
We will continue to watch the tectonic movements in the global economy for signs of stress, because while we enjoy quiet markets and low volatility now, we appear to be on the cusp of an unknown period where the global punch bowl slowly gets removed from the party. And, I’m bound and determined to make sure we don’t get stuck with the proverbial bill. Food for thought.
If you feel like at any moment this market could turn around – and in a hurry—subscribe to The Sevens Report!
 Join hundreds of advisors from huge brokerage firms like Morgan Stanley, Merrill Lynch, Wells Fargo Advisors, Raymond James and more… see if