Last Week in Review
Up until Friday, last week’s data looked like it was going to show “green shoots” of an economic reflation. But disappointing economic growth numbers on Friday off-set better inflation readings from earlier in the week, and while Hurricane Harvey likely impacted the growth data, the bottom line is the data just isn’t good enough to spur a rising tide for stocks.
From a Fed standpoint, the higher inflation data did increase the likelihood that we will get a December rate hike, although the market expectation of that remains below 50%. As such, increased expectations of a rate hike in the coming weeks could be a headwind on stocks, especially if economic data doesn’t improve.
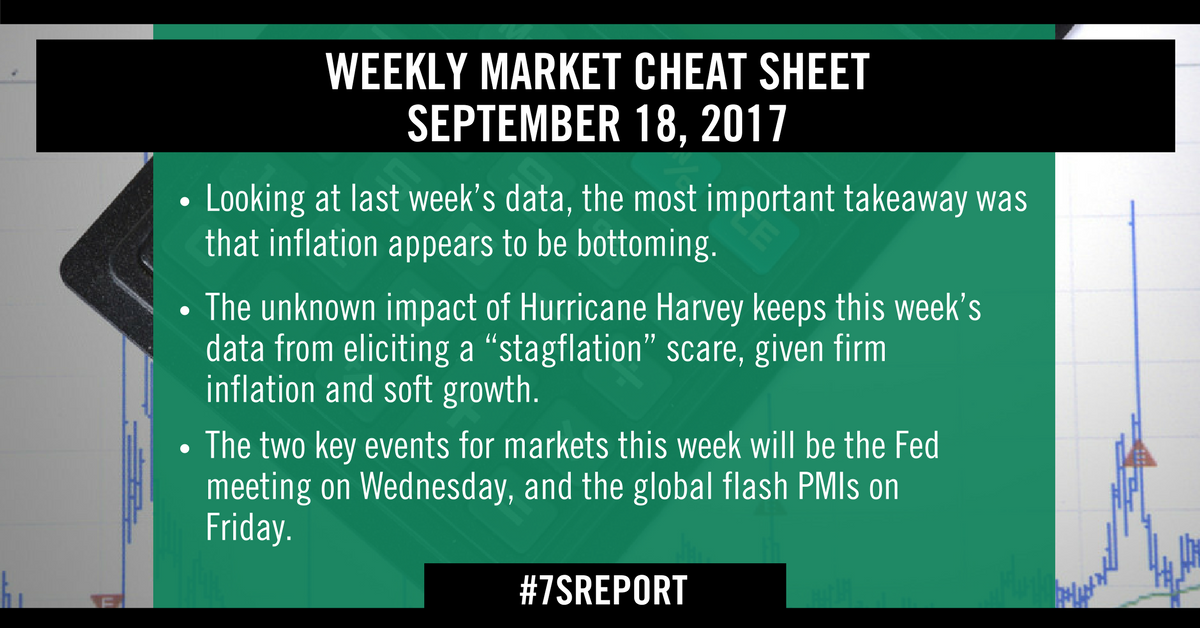
Looking at last week’s data, the most important takeaway was that inflation appears to be bottoming. Chinese, (1.8% yoy vs. (E) 1.7% yoy), British (2.7% vs. (E) 2.5%), and US CPI (0.4% m/m vs. (E) 0.3%) all firmed up and beat expectations, and while it’s just one month’s data, it’s still a break of a pretty consistent downtrend.
That turn in inflation potentially matters, a lot, because it’s making central banks become more hawkish. The ECB is going to taper QE, the Bank of England is going to raise rates sooner rather than later (more on that in Currencies), the Fed may hike again in December and the Bank of Canada was the first major central bank to give us a surprise rate hike in nearly a decade. I’m going to be covering the implications of this a lot more this week, but the times, so it seems, they are a changin’.
That makes an acceleration in economic growth now even more important. Unfortunately, the growth data from last week was disappointing. July retail sales missed on the headline (-0.2% vs. (E) 0.1%) as did the
more important “Control” group (retail sales minus autos, gas and building materials). The “control” group fell to -0.2% vs. (E) 0.3%.
Additionally, Industrial Production also was a miss. Headline IP fell to -0.9% vs. (E) 0.1% while the manufacturing subcomponent declined to -0.3% vs. (E) 0.1%. Now, to be fair, Hurricane Harvey, which hit Southeast Texas, likely skewed the numbers negatively. But, the impact of that is unclear, and we can’t just dismiss these numbers because of the hurricane.
Bottom line, the unknown impact of Hurricane Harvey keeps this week’s data from eliciting a “stagflation” scare, given firm inflation and soft growth. But if this is the start of a trend, and it can’t be blamed on Harvey or Irma, then that’s a problem for stocks down the road. We need both inflation and growth to accelerate (and at the same time) to lift stocks to material new highs.
This Week’s Preview
The two key events for markets this week will be the Fed meeting on Wednesday, and the global flash PMIs on Friday.
Starting with the Fed, normally I’d assume this meeting will be anti-climactic, but it’s one of the meetings with the “dots” and economic projections, so there is the chance we get either a hawkish or dovish surprise. I’ll do my full FOMC Preview in tomorrow’s report, but the point here is don’t be fooled into a false sense of security if people you read say this meeting is going to be a non-event. It very well could be, but there’s a betterthan-expected chance for a surprise, too (and if I had to guess which way, I’d say it’d be a hawkish surprise… and that could hit stocks).
Turning then to the upcoming data, given the new-found incremental hawkishness of global central banks, strong growth data is more important than ever to avoid stagflation. We’ll want to see firm global manufacturing PMIs to keep stagflation concerns at bay. Looking more specifically at the US, Philly Fed comes Thursday and that will give us anecdotal insight into manufacturing activity, although the national flash PMI out the next day will effectively steal the thunder from the Philly report.
Time is money. Spend more time making money and less time researching markets every day. Subscribe to the 7sReport.com.