Another Oil Plunge, Futures Down, May 3, 2017
 The Sevens Report is everything you need to know about the market, in your inbox by 7am, in seven minutes or less.
Oil futures sank 2.74% yesterday, with a large portion of the losses coming in the final hour. The catalyst for the decline was a collection of analysts’ estimates for this morning’s EIA report that started to come in showing more substantial builds in product inventories even though oil stocks are supposed to fall.
RBOB gasoline futures have been leading the way lower since they topped out on April 12. In fact, since that day, futures have only notched one single gain (that is three weeks with just one positive trading day). Gasoline futures now are within 3% of their 2017 lows, and if the downtrend continues that will be a headwind on the rest of the energy space.
Oil futures came within 1% of their 2017 lows yesterday and the momentum is clearly with the bears. Yesterday’s move was amplified by a “stop run” as futures broke through the March lows in the June contract. But in an encouraging sign of weakness, futures were unable to rebound.
On the charts, futures broke through a longstanding technical uptrend line that dated back to early August. That is another sign of technical weakness in the market.
In doing some cross-asset analysis yesterday, there was evidence that the inverse correlation between oil prices and long bond prices is resurfacing. As a reminder, for a period of time back in early 2016, long bond futures were trading almost exclusively off of the price of oil (specifically when WTI had a $20 handle). The reasons were twofold.
First, low oil prices are a drag on inflation readings, which would have dovish implications for Fed policy (long bond positive). Second, long bonds benefited from a safe-haven/fear bid as lower oil prices increased the risk of small producers defaulting on loans, many of which were issued by southern and central regional banks. Ultimately, contagion fears weighed on regional banks and the broader financial sector collectively. Now, it is not clear whether this is happening again as it was only one day of trading so far, but it is something to keep in mind going forward. If oil declines cause a sharp break lower in longer-term interest rates, that will weigh on stocks.
Bottom line, the fundamentals (rising US production and still-overflowing global stockpiles), technicals (new five-week lows), and market internals (bearish term structure) all continue to favor the oil bears right now, and the idea that we are in a “lower for longer” price environment still stands.
Oil and the rest of the energy complex is, however, near-term oversold, and we could see a volatile short covering rally given the right catalyst. Such a move would likely be short-lived, and if we were to see a continued move into the low $40s or even high $30s that would have serious implications for all asset classes (as in early 2016).
Skip the jargon, arcane details and drab statistics from in-house research, and get the simple analysis that will improve your performance. The Sevens Report is the daily market cheat sheet our subscribers use to keep up on markets, seize opportunities, avoid risks and get more assets. Start your free two-week trial today.
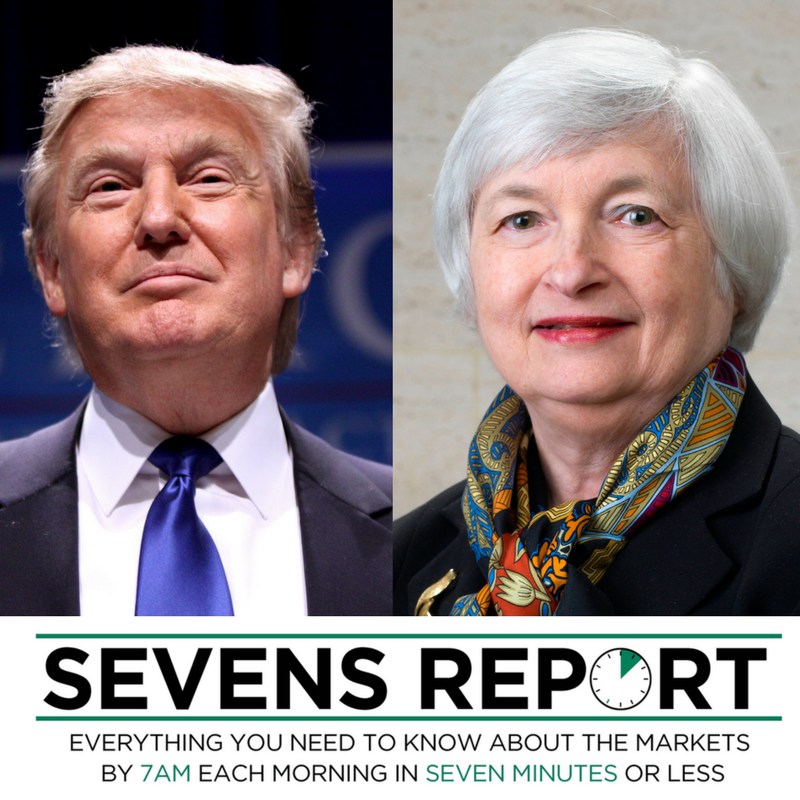 President Trump, in an interview with the WSJ yesterday, appeared to change his policy on the Fed and interest rates. Specifically, Trump said he thought the dollar was getting too strong, that he favored a low interest rate policy, and he was open to keeping Yellen as Fed Chair. It was the second two comments that caught markets attention and caused a “dovish” response in the dollar and bond yields (both of which fell).
 Specifically, when stocks rally I like to see: 1) Bond yields rising, which reflects investors expecting greater economic growth and inflation (two stock positive events). 2) A steepening yield curve, which also reflects rising inflation expectations and increased demand for money via loans (something that has been sorely missing from this recovery). 3) I like to see “riskier” parts of the bond market, specifically junk bonds, rising (or at least holding flat) as investors show confidence in corporate America by lending money to riskier companies in search of greater yield (it’s an anecdotal risk-on signal).