Posts

Why Yesterday’s Decline Wasn’t Just About North Korea, August 11, 2017

The Sevens Report is everything you need to know about the markets in your inbox by 7am, in 7 minutes or less. Start your free two-week trial today and see what a difference the Sevens Report can make.
Why yesterday's decline wasn't just about North Korea

Thursday was another risk-off day in the currency and bond markets thanks to North Korea, but there were some underwhelming economic reports that shouldn’t be missed, either. The Dollar Index fell 0.09% and never strayed too far from unchanged, in part due to the looming CPI report out this morning.

Starting with the obvious, North Korean angst again kept a lid on most currencies and pushed the yen higher, in classic risk-off trade (although importantly, the moves were mild and currencies and bonds did not confirm the angst in stocks).

However, beyond North Korea there was important economic data that did also impact currencies, and again I maintain that unless we get a big deterioration in the North Korea situation the data remains more important for the remainder than the geopolitical landscape.

First, US PPI was soft, declining for the first time in months and again reinforcing the idea of slowing inflation. Now, PPI isn’t as important to the Fed or markets as CPI, but the bottom line is that if we are in (or approaching) an economic reflation, we shouldn’t see these types of underwhelming inflation reports.

That soft PPI weighed slightly on the dollar and bond yields, although again it was largely overshadowed from a market standpoint by North Korea and today’s CPI.

Looking internationally, the euro was flat all day vs. the dollar amidst little news, while the pound dipped 0.26%. The reason for the pound weakness wasn’t just risk off in the markets. It also was due to an underwhelming Industrial Production report. While the headline number beat estimates (0.5% vs. (E) 0.2%), the manufacturing sub-component was flat vs. (E) 0.2%. That was why the pound dipped back below 1.30 vs. the dollar.

The big gainer vs. the dollar yesterday was, again, the yen, which rallied 0.55% on a standard risk-off move. Economic data in Japan yesterday was, at best, mixed, but the yen isn’t trading off data right now… it’s trading off sentiment. And, the North Korea news is causing a flight to safety, and that means higher yen, higher Treasuries and, for now, higher gold.

Turning to bonds, Treasuries rallied as the 10 year rose 0.11% and the 10-year yield fell below support at 2.22%, although that drop happened into the close.

Bottom line, this flare up in North Korea has put the 10-year yield at a critical technical crossroads. If CPI is light this morning, the 10-year yield will likely drop below 2.20%. At that point, a test of the 2017 lows certainly isn’t out of the question. And, we’d find that disconcerting for multiple reasons, chief of which because it would imply too low inflation and largely destroy the chances for a reflationary rally in stocks in 2017.

We maintain that an economic reflation (higher growth, higher inflation, higher rates) is the only path to a sustainable medium- and long-term rally. While it may cause more of a decline short term, the medium- and longer-term investor in us is hoping for a strong CPI report later today. Unfortunately, I have a sneaking suspicion I will be disappointed. I hope I’m wrong.

Time is money. Spend more time making money and less time researching markets every day. Subscribe to the 7sReport.com.

Is the Earnings Rally Losing Steam?

Join hundreds of advisors from huge brokerage firms like Morgan Stanley, Merrill Lynch, Wells Fargo Advisors, Raymond James and more… see if The Sevens Report is right for you with a free two-week trial.

Earnings have been an unsung hero of the 2017 rally, but there are some anecdotal signs that strong earnings may already be fully priced into stocks, leaving a lack of potential positive catalysts given the macro environment.

Now, to be clear, earnings season has been (on the surface) good. From a broad standpoint, the results have pushed expected 2018 S&P 500 EPS slightly higher (to $139) and that’s enough to justify current valuations, taken in the context of a calm macro horizon and still-low bond yields.

However, the market’s reaction to strong earnings is sending some caution signals throughout the investor
community. Specifically, according to a BAML report I read earlier this week, the vast majority of companies who reported a beat on the top line (revenues) and bottom line (earnings) saw virtually no post-earnings rally this quarter. Getting specific, by the published date of the report (earlier this week) 174 S&P 500 companies had beat on the top and bottom line, yet the average gain for those stocks 24 hours after the announcement was… 0%. They were flat. To boot, five days after the results, on average these 174 companies had underperformed the market!

That’s in stark contrast to the 1.6%, 24-hour gain that companies who beat on the revenues and earnings have enjoyed, on average, since 2000.

In fact, the last time we saw this type of post earnings/sales beat non-reaction was Q2 of 2000. It could be random, but that’s not exactly the best reference point.

So, if we’re facing a market that’s fully priced in strong earnings, the important question then becomes, what will spur even more earnings growth?

Potential answers are: 1) A rising tide of economic activity, although that’s not currently happening. Another is 2) A surge in productivity that increases the bottom line. But, productivity growth has been elusive for nearly a decade, and it’s unclear what would suddenly spark a revival. Finally, another candidate is 3) Rising inflation that would allow for price and margin increases. Yet as we know, that’s not exactly threatening right now, either.

Bottom line, earnings have been the unsung hero of this market throughout 2017, but this is a, “What Have You Don’t For Me Lately” market, especially at nearly 18X next year’s earnings. If earnings growth begins to slow and we don’t get any uptick in economic growth or pro-growth policies from Washington, then it’s hard to see what will push this market higher beyond just general momentum (and general momentum may be fading, at least according to the price action in tech). To be clear, the trend in stocks is still higher, but the environment isn’t as benign as sentiment, the VIX or the financial media would have you believe.

Time is money. Spend more time making money and less time researching markets every day—start your free trial of the Sevens Report now.

Are Banks About to Break Out?

Join hundreds of advisors from huge brokerage firms like Morgan Stanley, Merrill Lynch, Wells Fargo Advisors, Raymond James and more… see if The Sevens Report is right for you with a free two-week trial.

Banks were again the highlight, as BKX rose 0.83%, and that pulled the Financials SPDR (XLF) up 0.72%. The bank stock strength came despite the decline in yields, which we think is notable. In fact, over the past several trading days, bank stock performance has decoupled from the daily gyrations of Treasury yields, and we think that potentially signals two important events.

Regardless, this price action in banks is potentially important, because this market must be led higher by either tech or banks/financials. If the former is faltering (and I’m not saying it is), then the latter must assume a leadership role in order for this really to continue.First, it implies bank investors are starting to focus on the value in the sector and on the capital return plans from banks, which could boost total return. Second, it potentially implies that investors aren’t fearing a renewed plunge in Treasury yields (if right, that could be a positive for the markets).

Bottom Line

This remains a market broadly in search of a catalyst, but absent any news, the path of least resistance remains higher, buoyed by an incrementally dovish Fed, solid earnings growth, and ok (if unimpressive) economic data.

Nonetheless, complacency, represented via a low VIX, remains on the rise, and markets are still stretched by any valuation metric. Barring an uptick in economic growth or inflation, it remains unclear what will power stocks materially higher from here. For now, the trend remains higher.

Time is money. Spend more time making money and less time researching markets every day—start your free trial of the Sevens Report now.

Weekly Market Cheat Sheet, July 31, 2017

Join hundreds of advisors from huge brokerage firms like Morgan Stanley, Merrill Lynch, Wells Fargo Advisors, Raymond James and more… see if The Sevens Report is right for you with a free two-week trial.

Last Week in Review

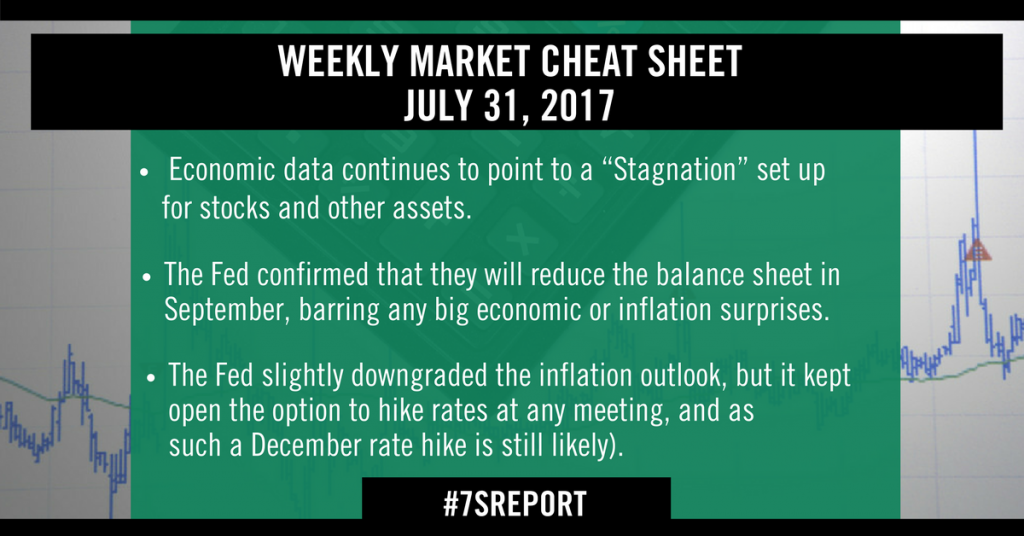
Data has been remarkably consistent the last few weeks, including last week: “OK” but not great economic growth, and consistent signs that inflation is losing momentum. As such, the economic data continues to point to a “Stagnation” set up for stocks and other assets.

Given that inflation trends are more important than growth trends right now, I’ll start with the Quarterly Employment Cost Index, which, like many other inflation indicators in Q2, slightly missed estimates. The Q2 ECI rose 0.5% vs. (E) 0.6, maintaining a 2.4% yoy increase from Q1, but slightly disappointing vs. expectations.

Additionally on Friday, the PCE Price Indices from the Q2 GDP report showed deceleration in the pace of inflation. The PCE Price Index rose just 1% in Q2 vs. (E) 1.2%. Now, none of these inflation statistics are particularly bad. Yet from a policy standpoint, these numbers won’t make the Fed eager to tighten policy ahead of the current schedule (balance sheet reduction in September, rate hike, probably, in December).

Turning to actual growth data, it was “ok” but not great. Q2 GDP met expectations with a 2.6% yoy gain, and that was a true number as Final Sales of Domestic Product (which is GDP less inventories) was also 2.6%. Consumer Spending, or PCE as it’s known in the GDP report, rose 2.8%, again a solid but unspectacular number.

Similarly, June Durable Goods, while a decent report, wasn’t that strong. The headline was a big beat at 6.5% vs. (E) 3.5%, but that was because of one-time airline orders. New Orders for Non-Defense Capital Goods ex-aircraft, the best proxy for corporate spending and investment, was revised higher in May but dipped 0.1% in June.

Point being, like most growth data recently, it wasn’t a bad report, but it’s not the kind of strength that will spur a reflationary rally.

Finally, the one economic data point that was strong last week was the July flash manufacturing PMI. It rose to 54.2 vs. (E) 53.2, but while that is a potential positive (it’s a July report so it’s the most current) the PMIs are surveys, and the gap between soft survey data and “hard” economic numbers remains wide.

Turning to the Fed meeting last week, the two takeaways were: 1) The Fed confirmed that they will reduce the balance sheet in September, barring any big economic or inflation surprises. 2) The Fed did slightly downgrade the inflation outlook, but importantly it kept open the option to hike rates at any meeting, and as such a December rate hike is still likely).

This Week’s Preview

As stated, inflation is more important than growth data right now, so that means two most important numbers this week will be tomorrow’s Core PCE Price Index (contained in the Personal Income and Outlays report) and Friday’s wage data in the jobs report.

Stocks have rallied since Yellen turned incrementally dovish at her Humphrey-Hawkins testimony, and soft inflation data will further that sentiment and underpin stocks.

Conversely, if we see inflation bounce back, that will push bond yields higher and help reflation assets (banks, small caps, inverse bond funds, cyclicals).

But, inflation stats aren’t the only important numbers this week as we get the latest final manufacturing and composite US and global PMIs. They remain important because they will provide anecdotal insight into the pace of the US and global economy. But again, it would be a pretty big surprise if the data suddenly showed slowing in the global economy.

On the flip side, at least for the US, a strong report would be welcome, because strong economic data won’t cause the Fed to get more “hawkish” unless inflation ticks higher.

Time is money. Spend more time making money and less time researching markets every day.

Weekly Market Cheat Sheet, July 24, 2017

Join hundreds of advisors from huge brokerage firms like Morgan Stanley, Merrill Lynch, Wells Fargo Advisors, Raymond James and more… see if The Sevens Report is right for you with a free two-week trial.

Last Week in Review

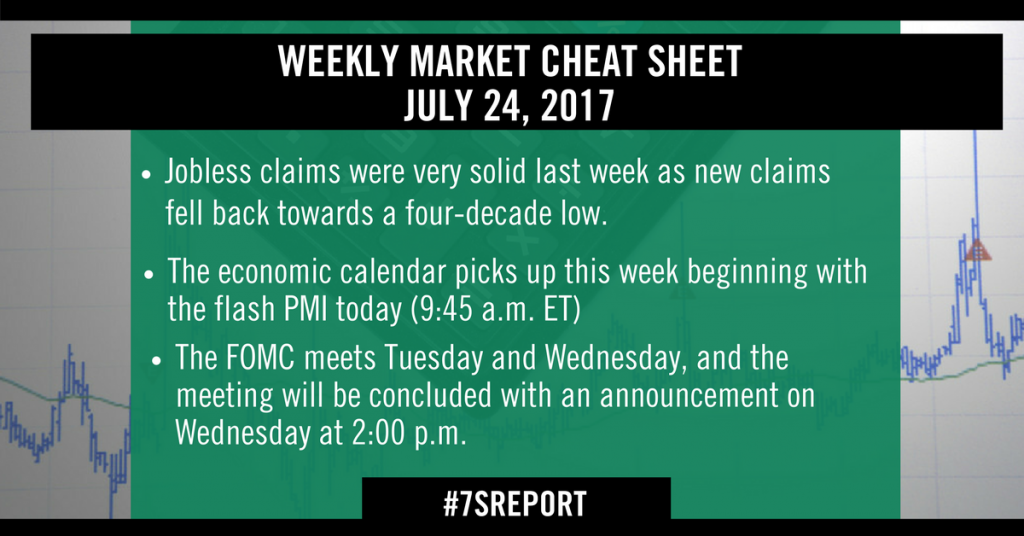
The economic calendar picks up this week beginning with the flash PMI today (9:45 a.m. ET), as we continue to get an initial look at the July data. So far, the data has been a bit underwhelming as both the Empire and Philly Fed surveys came in light last week.

As far as hard data goes, Durable Goods comes out Thursday, and the preliminary second-quarter GDP number comes out Friday.

Housing data also picks up this week, and after last week’s mixed results (remember the Housing Market Index missed but Housing Starts was solid) economists will be looking for a better read on the current status of the real estate market. The two big reports this week are Existing Home Sales on Monday, and New Home Sales on Wednesday. However, the S&P CoreLogic Case-Shiller HPI also will be worth watching (due out Tuesday). If the housing data is more in line with the strong Housing Starts data we saw last week, that will be an underlying positive for the economy and supportive for risk assets near term.

Turning to the central banks, the FOMC meets Tuesday and Wednesday, and the meeting will be concluded with an announcement on Wednesday at 2:00 p.m. There are no material changes expected to come from the meeting, and it would be a shock if rates were not left unchanged. There is no press conference or forecasts released with this meeting, but language in the statement will be closely watched for any further clues on the Fed’s plans to reduce the balance sheet, or on when rates will be raised. Right now, expectations are for a December hike, but based on the trend in other central bank rhetoric the risk is for a dovish development due to the complete lack of inflation acceleration.

This Week’s Preview

Economic data was thin last week, but we did get our first look at July data in the form of regional Fed outlook surveys as well as a few reports on the housing markets.

Beginning with the Fed surveys, the Empire State Manufacturing Survey was released on Monday, and despite the bad headline it was not a terrible report. The headline missed estimates (9.8 vs. E: 15.0), but the forward looking New Orders component remained solidly above 13. The reason the report was not that bad was the fact that it had started to run hot at unsustainable level recently, and was due for a dip. And the correction we saw in the June data wasn’t too deep, and the details remained encouraging.

The Philly Fed Survey out on Thursday was not as bad a miss as the Empire data on the headline (19.5 vs. E: 22.0), but the details definitely dimmed the outlook for the Mid-Atlantic manufacturing sector. The forward-looking component of the report, New Orders, fell more than 20 points to just 2.1. The survey Philly data last week finally started to show a decline in enthusiasm from the extremely strong survey reports we’ve seen since the election. If these reports are foreshadowing a pullback in the broader US economy, that would be very bad for stocks, as solid growth is still priced into the market at current levels.

Housing data was mixed last week as the Housing Market Index missed expectations, but Housing Starts and Permits were very solid. Data on the real estate market has been all over the place recently, and it will take more data to try to decipher where the trends actually are in the sector. But if the strong Starts and Permits data from last week are any indication (this is a more material data point than the Housing Market Index) that will be a sign of confidence in the US economy.

Lastly, jobless claims were very solid last week as new claims fell back towards a four-decade low. The very positive weekly report was significant, because the data collected corresponds with the survey week for the July BLS Employment report. So, based on jobless claims alone we can expect another very strong official employment report early next month.

Time is money. Spend more time making money and less time researching markets every day.

Oil Update & What It Means for the Market, July 20, 2017

The Sevens Report is the daily market cheat sheet our subscribers use to keep up on markets, seize opportunities, avoid risks and get more assets.

Yesterday’s weekly inventory report from the EIA was universally bullish on the headline level as there were sizeable draws in crude oil stockpiles as well as in the refined products. The market responded favorably to the supply drops and WTI futures finished the day up 1.61%.

Beginning with those aforementioned headlines, commercial crude oil stocks fell –4.7M bbls last week, larger than analysts expectations of –3.1M and opposite from the API report that showed a build of +1.628M bbls.

Gasoline supply fell –4.4M bbls yesterday, and while that was less than the draw reported by the API (-5.4M) it was much larger than the average analyst estimate of –600K bbls.

Distillate inventories also fell –2.1M vs. (E) -700K rounding out a broadly bullish set of headlines in the report.

The details of the report however, once again showed a continuation in the bearish trend of rising US production. Lower 48 production (which filters out the seasonally volatile Alaskan data) rose another +30K b/d last week, above the 2017 average pace of +26K b/d to

8.97M b/d. Lower 48 production is now up +729K b/d so far in 2017, the highest level since late July 2015.

Bottom line, a string of supply draws over the last three weeks in crude oil and gasoline stocks totaling –18.6M bbls and –9.8M bbls, respectively, has offered the market some support, and helped curb a decline that pushed oil prices down to new 2017 lows. And with sentiment being very bearish coming into the month of July, the market was due for an upside correction. But, the underlying fundamentals remain bearish and as of now, we believe this is a counter-trend rally in an otherwise still broadly downward trending energy market. We won’t fight the rising tide, and a run at $50/barrel in WTI is very plausible, but we will be looking for signs of the trend to break in the weeks ahead and for the market to turn back lower based on fundamentals, market internals (term structure), and longer term technicals.

Help your clients outperform markets with The Sevens Report. Start your free two-week trial today.


Why “Credit Impulse” Matters to You, June 21, 2017

Credit Impulse Explained: There are many analysts and investors who believe that the entire ’09-’17 stock rally is nothing more than the result of a historic, globally coordinated credit creation event from the world’s major central banks. Put in layman’s terms, every major central bank in the world has done QE at some stage over the past eight years, and pumped the world full on cash. So, all they’ve done is create massive asset inflation in bonds, stocks and real estate.

Help your clients outperform markets with The Sevens Report—start your free two-week trial today.

Credit ImpulseQE is Quantitative easing. It is a “monetary policy in which a central bank creates new electronic money in order to buy government bonds or other financial assets to stimulate the economy (i.e., to increase private-sector spending and return inflation to its target).”
First, the theory goes, it was China’s central bank (the PBOC) and the Fed unleashing the initial wave of QE following the financial crisis in ’08/’09. Both central banks kept their foot on the accelerators over the next several years (remember QE1, QE2, Operation Twist, and then QE Infinity). In 2013, the Bank of Japan joined the Fed, PBOC and Bank of England at the QE party, only they came to really party, and upped the ante by creating a huge QE program.

Then, as the US and Chinese economies showed signs of life (finally) in 2015, the Fed and PBOC paused their QE/credit creation programs. And, whether causally or coincidentally, 2015 turned out to be one of the more volatile years in the markets in the last decade… and US stocks largely traded sideways until early 2016.

But by that point, the ECB had joined the QE party, and the PBOC restarted its credit creation machine following the economic scare of 2H 2015. So, even while the Fed has stopped QE, on a global basis the total amount of QE and credit in the system resumed a steep acceleration, as now the PBOC, BOJ and ECB were doing QE.

Again, coincidentally or causally, stocks broke out in February 2016, and they literally haven’t taken a break in 19 months (excluding two one-night scares with Brexit and the US election).

So, again, while there is no hard proof that this global expansion of credit has powered US (and now global) stocks higher, there certainly is at least a casual relationship if we look at history.

The reason I am pointing this out is simple: There are growing signs that the near-decade-long global credit creation/QE cycle appears to be nearing the end. First, there are the central bank actions. The Fed is hiking rates, and likely taking steps to reduce its balance sheet, draining liquidity from the system.

Second, the ECB appears to be on the verge of tapering its QE program, and while that will still result in a net credit increase for the next year, the pace of credit creation will slow. Finally, and perhaps most importantly, China continues to aggressively reduce credit in its economy, and I’ll again remind everyone the last time they did that, we got the volatility in 2H ’15.

This is where the “Credit Impulse” comes in.

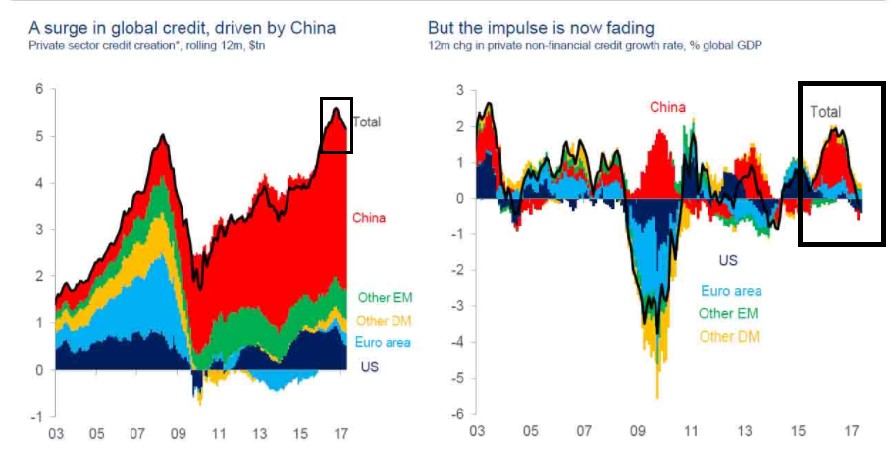
Credit Impulse is a term used by various research firms that measures the “Rate of Change of Change” of global credit creation/QE. Put simply, while the global amount of credit may still be rising, the pace of the increase has not only slowed… it’s turned negative. Similar to taking your foot off the gas while you’re still going forward. It’s just a matter of time until you stop.

Getting more granular, UBS has been out front on this issue, and back in February noted that Credit Impulse turned negative. In a much-anticipated report out last week, the firm said that the decline over the past three-to-four months has accelerated, with Credit Impulse dropping to -0.6% annualized over the past three months.

Now, Credit Impulse is a composite of various measures of credit, including loans, loan demand and other metrics, so this is not a hard-and-fast number. And the fact that it has turned negative doesn’t mean we’re looking at an impending collapse in stocks.

But if we look at the entire picture, negative Credit Impulse; a more-hawkish-than-expected Fed that’s apparently committed to reducing its balance sheet, a Chinese central bank that is apparently committed to reducing credit in that economy, and an ECB that will begin tapering QE in 2018… the fact is we appear to be nearing the end of the post-financial-crisis credit expansion, and with economic growth where it is, I cannot see how that will be positive for stocks longer term.

Bottom line, I’m not turning into ZeroHedge (although they are all over this), but the fact is that I sense a lot of complacence regarding the end of this global credit creation cycle.

People seem to think that because the Fed ended QE and hiked rates, and then nothing “bad” happened, that this means things will be ok. The only problem is they fail to consider that at the exact time the Fed stopped QE, the BOJ, ECB and PBOC all ramped up their QE programs. That means global liquidity continued to expand, and stocks and Treasuries have been the massive beneficiary.

So, there’s what keeps me up at night, i.e., what happens in 12 months if the only central bank still doing QE is the BOJ? Maybe nothing, but I can’t be sure, especially considering current economic growth.

We will continue to watch the tectonic movements in the global economy for signs of stress, because while we enjoy quiet markets and low volatility now, we appear to be on the cusp of an unknown period where the global punch bowl slowly gets removed from the party. And, I’m bound and determined to make sure we don’t get stuck with the proverbial bill. Food for thought.

If you feel like at any moment this market could turn around – and in a hurry—subscribe to The Sevens Report!

FOMC Preview and Projections plus the Wildcard to Watch, June 13, 2017

FOMC Preview: Get the simple talking points you need to strengthen your client relationships with a free trial of The Sevens Report.

The Fed meeting is more important than any other this year, for the simple reason that it could either exacerbate the glaring discrepancy between stocks and bond yields (which would be negative for risk assets medium term), or it could help close the gap (which would be positive for risk assets).

Specifically, the bond market has quietly been pricing in the expectation of a “dovish hike” for this meeting via the decline in yields. That “Dovish Hike” means the Fed does hike rates 25 basis points, but makes the statement dovish enough that it doesn’t cause longer-dated yields (i.e. 10- and 30-year Treasuries) to rise. If the Fed executes on that expectation, then we will see the 10-year yield dip and likely test the 2017 lows of 2.14%, and again that is a problem for stocks over the medium/ longer term.

Looking at the actual meeting itself, whether it meets expectations, is dovish, or is hawkish, will depend not only on the rate hike, but also the inflation commentary and any guidance regarding “normalization” of the balance sheet.

What’s Expected: A Dovish Hike. Probability (this is just my best guess) About 70%. Rates: It would be a pretty big shock if the Fed didn’t hike rates tomorrow, so a 25-basis-point hike to 1.25% is universally expected. Statement: In paragraph one, the Fed should include some additional soft language regarding inflation, noting that it’s been soft for a few months. However (and this is important), the Fed should still attribute sluggish inflation to “transitory factors,” implying Fed members are still confident they will hit their 2% inflation goal. Dots: No change to the 2017 dots (so, still showing three hikes as the median expectation). Likely Market Reaction: Withheld for Sevens Report subscribers. Unlock by starting your free trial today.

Dovish If: No Hike or a Very Dovish Hike. Probability (again, my best guess) About 10%. Rates: It’s widely expected that Fed will hike rates, but there’s always a possibility of a surprise. More likely, the Fed will hike 25 bps and accompany it with a very dovish statement. Statement: The Fed changes the characterization of risks from “balanced” to “tilted to the downside,” or some similar commentary, thereby signaling rate hikes are off the table again. This is a very unlikely, but possible change. More likely is the Fed adding considerable language regarding concerns about lower inflation. Dots: A reduction of the dots to reflect just two rate hikes in 2017. Likely Market Reaction: Withheld for Sevens Report subscribers. Unlock by starting your free trial today.

Hawkish If: We get a regular hike, not a “Dovish” Hike. Probability About 20%. Rates: The Fed Hikes Rates 25 basis points. Statement: The Fed does not add softer language regarding growth or inflation in the first paragraph, and instead just largely reprints the May statement, which was dismissive of the recent dip in inflation and growth. Dots: The dots remain the same or even increase one rate hike in 2017 (this is unlikely, but possible). Likely Market Reaction: Withheld for Sevens Report subscribers. Unlock by starting your free trial today.

Wild Card to Watch: The Fed Balance Sheet

The market fully expects the Fed to elaborate on when and how it intends to reduce its balance sheet (i.e. the holdings of Treasuries it has purchased over the years through the QE program).

I covered why the balance sheet is important back in April (a link to that report is here) but the bottom line is that when and how the Fed begins to reduce its balance sheet (the term “normalize” is just Fed speak for “reduce Treasury holdings”) could be a substantially hawkish influence on the bond market, regardless of rate hikes.

Specifically for tomorrow, the key detail the market will be looking for is at what level of interest rates does the Fed begin to reduce its Treasury holdings. The number to watch here is 1.5%. It’s widely expected that at 1.5% Fed funds, the Fed will begin to reduce its balance sheet. If we get one more rate hike this year, then that puts balance sheet reduction starting in early 2018 (likely March).

For a simple reference, if the Fed statement or Yellen at her press conference reveals the Fed will reduce holdings before 1.5%, that will be hawkish. If it’s revealed that the Fed will reduce holdings after rates hike 1.5% that will be dovish.

Bottom Line

This Fed meeting is likely the most important of the year (so far), not just because we will get updated guidance on expected rate hikes and the balance sheet, but also because it comes at a time when we are at a tipping point for bond yields (if they go much lower and the yield curve flattens, more people will start talking recession risk). We also are potentially seeing a shift in stock sector leadership (from defensives/income to cyclicals/ banks), so understanding what the Fed decision means for rates will be critically important going forward. You’ll have our full analysis, along with practical takeaways, first thing Thursday morning.

Join hundreds of advisors from huge brokerage firms like Morgan Stanley, Merrill Lynch, Wells Fargo Advisors, Raymond James and more… see if The Sevens Report is right for you with a free two-week trial. 

Tom Essaye on “The Bell” Podcast with Charles Nenner of Goldman Sachs and Adam Johnson

Bullseye Brief with Charles Nenner, Tom Essaye, Adam Johnson

Thanks to Adam Johnson for having me on his podcast “The Bell” again last week. We talked with Goldman Sachs Strategist Charles Nenner on Cycles, Shorts, and Sunspots. We also talk about the data deluge, incredibly high credit scores, and the very busy week in economic data. Plus, find out who’s shorting Costco… and why? What’s the secret to retail?


Get a free two-week trial of Tom Essaye’s Sevens Report—everything you need to know about the markets in your inbox by 7am, in 7 minutes or less.

Subscribe to The Bell:

Subscribe on iTunes:
http://apple.co/2pxsTIM

Subscribe on Stitcher:
http://bit.ly/2pySjTw

Subscribe on Google Play:
http://bit.ly/2peLMR9

Weekly Market Cheat Sheet, May 22, 2017

The Sevens Report is the daily markets cheat sheet our subscribers use to keep up on markets, leading indicators, seize opportunities, avoid risks and get more assets. Get a free two-week trial with no obligation, just tell us where to send it.

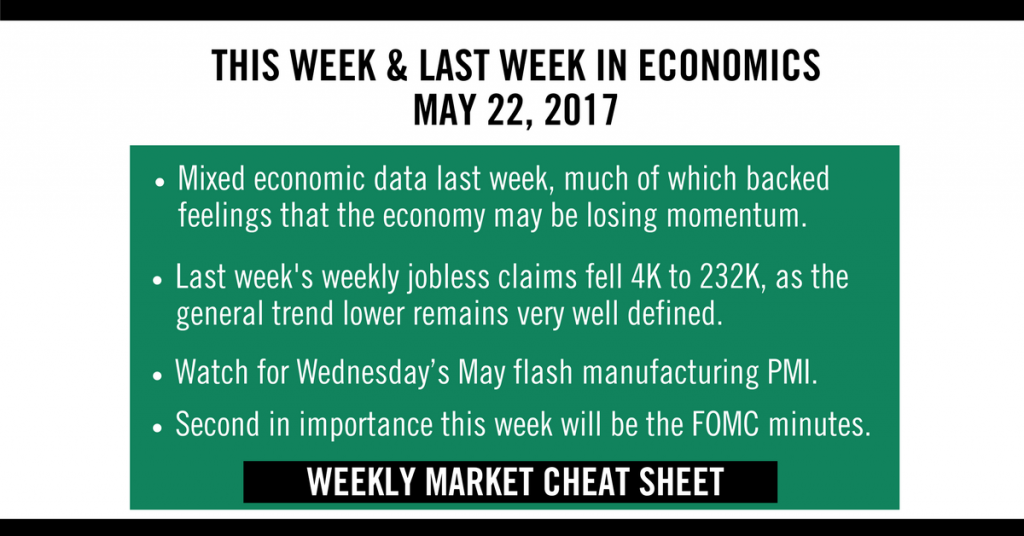
Economic and Investing Cheat Sheet - May 22

Last Week in Review:

There weren’t many economic reports last week, and the data we did get was mixed. In sum the data did nothing to remove the growing feeling that the US economy is losing momentum.

First, the initial look at May data in the form of the Empire State Manufacturing Index badly missed at -1.0 vs. (E) 8.0, but the Philly Fed Business Outlook Survey on Thursday contrarily blew away expectations (38.8 vs. E: 19.6). The net effect is that it put more focus on this week’s flash manufacturing PMI to give us a true look at the pace of manufacturing activity in May.

In the US housing market, the Housing Market Index beat expectations on Monday (70 vs. E: 68), but Housing Starts data on Tuesday whiffed (1.172M vs. E: 1.256M).

The most encouraging report last week was Industrial Production, which beat estimates of 0.4% with a headline print of 1.0%. But, a lot of that “beat” came from auto manufacturing, and activity in that sector has almost certainly peaked (remember Ford is cutting employees amidst more challenging sales environments). Point being, the Industrial Production beat is likely a one off, not the start of a trend.

Rounding things out with the labor market, weekly jobless claims fell 4K to 232K, as the general trend lower remains very well defined. Continuing claims fell to a 29-year low while its four-week moving average fell to a 43-year low. This encouraging report was especially notable because the data was collected from the week corresponding with the survey week for the May jobs report, and the strong print suggests that May could be another very strong month for the labor market. Bottom line, economic data last week did not materially change our outlook for the markets.

This Week’s Preview:

This will actually be a relatively busy week of economic data, as we get the flash manufacturing PMIs, Fed minutes from the May meeting, and other important economic reports.

The most important report this week will be Wednesday’s May flash manufacturing PMI. This will be the first major data point for May and it needs to show stabilization and, better yet, acceleration for stocks to rally.

Second in importance this week will be the FOMC minutes. Markets have priced in a slightly more dovish Fed given the soft inflation data recently, but markets have overestimated the Fed’s dovishness throughout 2017. If the minutes are hawkish, that could push yields and the dollar higher (which would be stock positive).

Meanwhile, there are two reports on housing data, New Home Sales and Existing Home Sales due out on Tuesday and Wednesday, respectively. Investors would welcome a rebound after last week’s soft Housing Starts report.

Finally, both the second look at Q1 GDP and Durable Goods Orders will be released Friday morning. The latter will be closely watched as the gap between soft and hard data remains a concern, and a strong revision to GDP and a good Durable Goods number will help close that gap. Bottom line, economic data remains the key to reigniting the reflation trade (remember, it’s #1 in my list of four events needed to restart the rally). So, the market needs good data and a confident/hawkish Fed for stocks to again test recent highs.

Get the simple talking points you need to strengthen your client relationships with the Sevens Report. Everything you need to know about the markets delivered to your inbox by 7am each morning, in 7 minutes or less.