What’s in Today’s Report:
- What Falling RV Sales Mean for the Economy (Not Necessarily What You Think)
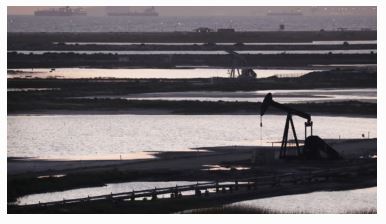
- Oil/Energy Market Update
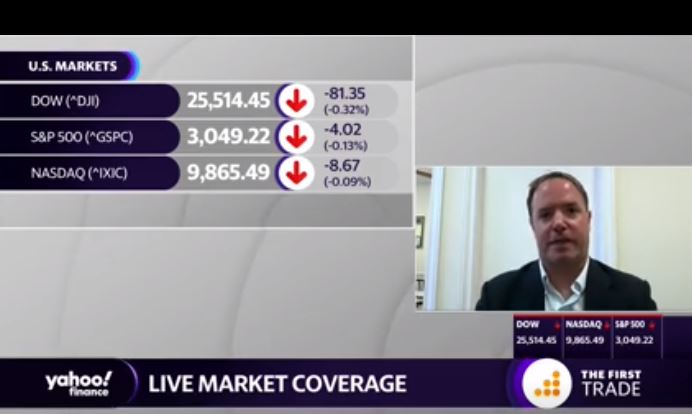
Futures are flat following a busy night of earnings as investors look ahead to the ECB decision later this morning.
Economic data again disappointed as the German IFO Business Expectations missed estimates (92.2 vs. (E) 94.0).
There was an earnings deluge overnight and results, on balance, were slightly negative although the Q2 earnings season remains better than feared.
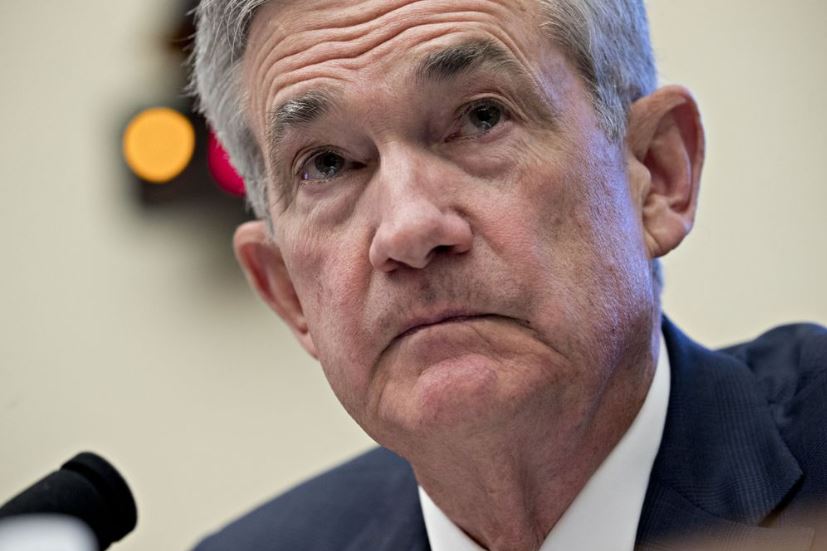
Today the most important event is the ECB Decision and we get the announcement at 7:45 a.m. and the press conference at 8:30 a.m. The key for this meeting is how definitive the ECB will be on more rate cuts and QE.
If they cut rates and announce the start of a new QE plan, that’ll be a dovish surprise (good for stocks), if they effectively promise a rate cut and more QE at the September meeting, that will meet expectations (not a big market reaction) and if they merely state both moves are possibilities if growth slows further, that will be a hawkish disappointment (stocks likely will fall).
Outside of the ECB we get two notable economic reports via Durable Goods Orders (E: 0.7%) and Jobless Claims (E: 210K).