Tom Essaye Quoted in FinTech Zoom on August 13, 2020
“The market nonetheless needs, and really a lot expects, a precise stimulus invoice to be signed…” wrote Tom Essaye, editor of the Sevens Report. Click here to read the full article.

“The market nonetheless needs, and really a lot expects, a precise stimulus invoice to be signed…” wrote Tom Essaye, editor of the Sevens Report. Click here to read the full article.
”In a televised meeting, Russian President, Vladimir Putin, stated that Moscow’s Gamaleya Institute successfully developed a ‘safe and effective’…” writes The Sevens Reports Tom Essaye. Click here to read the full article.
“The market still wants, and very much expects, an actual stimulus bill to be signed. Looking forward, stimulus bill negotiations will…” wrote Tom Essaye, editor of the Sevens Report. Click here to read the full article.
What’s in Today’s Report:
Futures are modestly lower following a night of disappointing economic data and more signs coronavirus is rebounding in Europe.
Chinese Industrial Production (4.8% vs. (E) 5.1%) and Retail Sales (-1.1% vs. (E) 0.3%) both missed estimates, while EU Flash GDP met very low estimates (-12.1%).
Britain added France to its list of quarantine countries, underscoring the steady rebound of coronavirus in Europe (although levels of the virus in Europe are still very low compared to the U.S.).
Today there are three notable economic reports: Retail Sales (E: 1.8%), Industrial Production (E: 3.0%) and Consumer Sentiment (E: 71.9). Consumer Sentiment is the most important number because it’s the most recent, although solid numbers in retail sales and IP will help reinforce the idea that economic recovery is still on-going (and hasn’t paused) and will help limit any downside in equities today. There’s also one Fed speaker today, Kaplan at 10:00 a.m. ET, but he shouldn’t move markets.
What’s in Today’s Report:
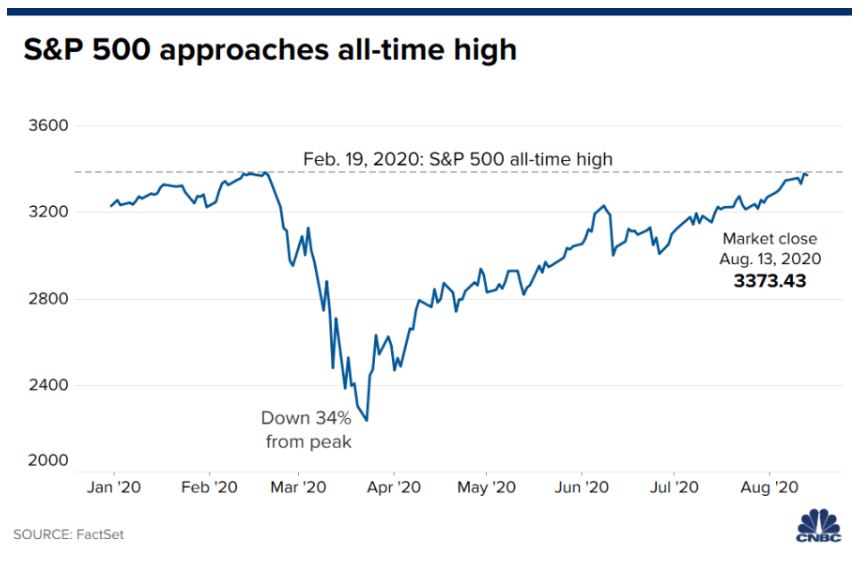
S&P 500 futures are approaching record highs this morning amid news that Russia has approved a COVID-19 vaccine while investors remain optimistic for a U.S. stimulus deal.
In a televised meeting, Russian President, Vladimir Putin, stated that Moscow’s Gamaleya Institute successfully developed a “safe and effective” coronavirus vaccine ready to move to a Phase 3 trial, sparking risk-on money flows.
Economically, both the German ZEW Survey and the NFIB Small Business Optimism Index largely met estimates and importantly did not alter the narrative that the broader global economic recovery remains underway.
Today, there is one economic report: PPI (E: 0.3%) and one Fed official is scheduled to speak: Daly (12:00 p.m. ET) but neither should move markets as investors will be keenly focused on the details surrounding the Russian coronavirus vaccine as well as any new progress towards a deal on the next U.S. stimulus bill.
What’s in Today’s Report:
Futures are little changed as markets look past President Trump’s executive orders on economic stimulus following an otherwise quiet weekend.
With stimulus talks again at an impasse, President Trump issued several executive orders over the weekend to provide economic stimulus, including $300/week in federal unemployment and a payroll tax deferral.
But, for a multitude of reasons (legal and otherwise) none of these actions will have any immediate economic impact, so the market still expects a stimulus bill to be passed (but now in the coming weeks, not immediately).
Today there’s one labor market number, JOLTS (E: 5.288M), but that shouldn’t move markets, and instead focus will be on stimulus. Today, the key is that both the Democrats and Republicans signal they are going to continue negotiations on the stimulus bill. If the rhetoric implies the talks have stalled completely, that that will likely pressure stocks.
“The bottom line is that if we do see real disappointment in stimulus or the vaccine, then a 10% correction is the likely best-case scenario…” said Tom Essaye of The Sevens Report, in a note. Click here to read the full article.

What’s in Today’s Report:
Futures are moderately lower following lack of progress on the stimulus bill, combined with further escalation of U.S./China tech tensions.
Markets were hoping for a stimulus deal by today, but there’s been no progress on negotiations for two days. So while the market still fully expects a deal by next week, there is disappointment that it likely won’t get done by the end of this week.
U.S./China geo-political tensions continue to rise as President Trump issued an executive order banning U.S. transactions with the parent companies of TikTok and WeChat.
Focus today will be on the Employment Situation report and expectations are as follows: Job Adds: (E) 2.0M, Unemployment Rate: (E) 10.5%.
Bottom line, the strong economic data from earlier this week has made this jobs report more important than it was going to be, as this morning’s number now has the chance to signal the economic recovery is still on (a positive for stocks) or increase concern it’s stalling (which will be a headwind on equities, especially at these levels).
“The bottom line is that if we do see the real disappointment in the stimulus or the vaccine, then a 10% correction is the likely…” said Tom Essaye of The Sevens Report, in a note. Click here to read the full article.

What’s in Today’s Report:
Futures are little changed as solid economic data is offsetting mildly negative stimulus headlines.
Regarding stimulus, the headlines over the last 12 hours were slightly negative (more sticking points are emerging) but the market still expects a deal within the next few days and for that deal to be at the upper end of expectations (the weekly unemployment payments are looking to be $400/week into year-end, which is higher than market expectations).
Economic data was solid as German Manufacturers’ Orders (27.9% vs. (E) 9.6%) and the British Construction PMI (58.1 vs. (E) 57.0) both beat estimates.
Today the focus will be on the weekly Jobless Claims (E: 1.442M), and simply put the market does not want to see any further increases in weekly claims as that implies the recovery is pausing. A number above 1.5MM will likely put a headwind on stocks today (unless there’s positive stimulus headlines). There’s also one Fed speaker, Kaplan (E: 10:00 a.m. ET), but he shouldn’t move markets.