What’s in Today’s Report:
- Jobs Report Preview
- Why Is the Dollar Dropping So Sharply (Hint: It’s Not the Election)
- FOMC Reaction
Futures are moderately lower mostly on digestion of this week’s massive rally, although the political news over the last 24 hours was a slight negative for markets.
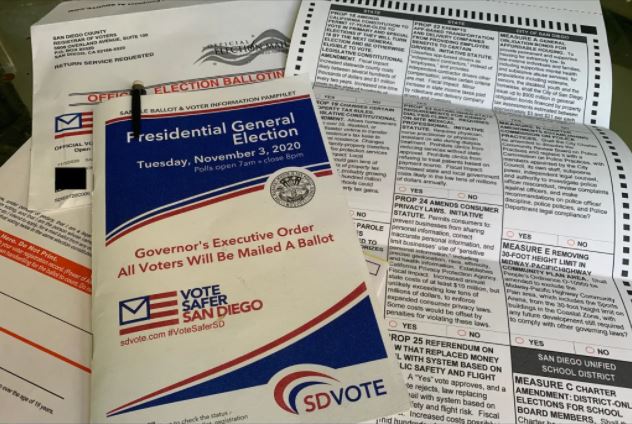
Biden continued to move closer to securing 270 Electoral College votes and is now leading in Georgia, Arizona, and Nevada, and some of those states may be called today.
However, both Georgia Senate races appear headed to a runoff in early January, and that could delay stimulus into early 2021 (this is the “reason” for the weakness in futures, other than just digestion).
Today focus will remain on the election as several states could be called, effectively ending the election (court cases will continue but as of yet none appear powerful enough to overturn the apparent result).
Economically, the jobs report will be in focus and the expectations are as follows: Job Adds: 600K, Unemployment Rate: 7.7%. A number moderately better than expectations (that’s strong enough to reflect a good recovery but not so strong that the amount of expected stimulus starts to move lower) is the best outcome for stocks.