What’s in Today’s Report:
- Market Multiple Update: October Update
Stock futures are little changed this morning after wavering between gains and losses overnight as investors eye rising COVID-19 cases, an uptick in lockdown measures in the U.S., as well as stimulus and vaccine uncertainties.
Several economic reports in the EU including the German ZEW Survey as well as the U.S. NFIB Small Business Optimism Index missed estimates which is acting as a headwind on stocks this morning.
Looking into today’s session there is one economic report to watch: September JOLTS (E: 6.508M) and two Fed officials are scheduled to speak: Rosengren (10:00 a.m. and 4:00 p.m. ET) and Brainard (5:00 p.m. ET).
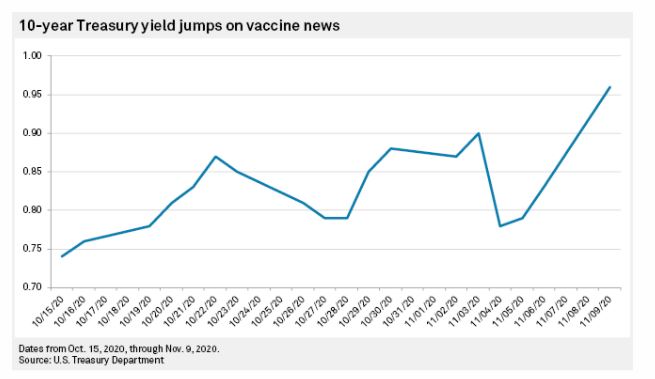
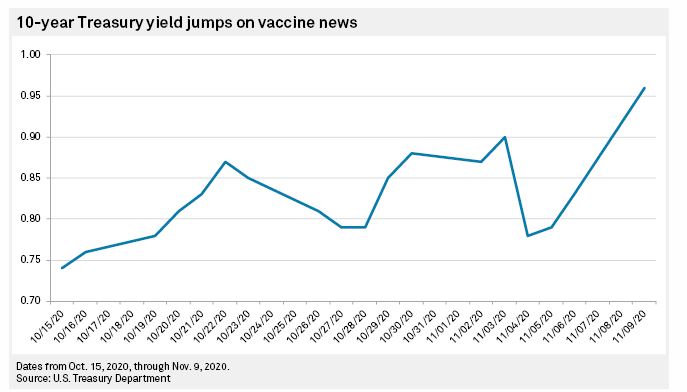
Additionally, the Treasury will hold a 10-Yr Note action at 1:00 p.m. ET and with the massive steepening we saw in the yield curve yesterday, the outcome could influence a further steepening trend which will eventually become a headwind for equities.
Outside of those potential catalysts, investor focus will remain on emerging details about the COVID-19 vaccine, specifically when it will be available and how it may impact the next stimulus package from Congress.