New Stock Highs, September 12, 2017

The Sevens Report is everything you need to know about the markets in your inbox by 7am, in 7 minutes or less. Start your free two-week trial today and see what a difference the Sevens Report can make.

Stocks surged to a new record high on Monday after the damage from Hurricane Irma wasn’t as bad as feared, and in the absence of North Korea performing an ICBM test over the weekend. The S&P 500 rose 1.08%.

Stocks were higher from the start on Monday thanks to the two aforementioned positive catalysts: Hurricane Irma and North Korea. Both events turned out to be not as bad as feared, and that caused a classic “buyers chasing” rally.

Reflecting the fact that it was those two “not negative” macro catalysts that sent stocks higher on Monday was the fact that the S&P 500 gapped higher at the open and rallied throughout the morning on that buyers chase. Then, stocks spent the afternoon grinding sideways near the day’s highs.

Outside of Irma/North Korea, there weren’t any notable catalysts in the markets Monday. Economic data was non-existent, as was any notable political or geopolitical news (outside of North Korea). Also helping stocks rally was the fact that the week’s important events (CPI, Retail Sales, Industrial Production) are on Thursday and Friday, and there aren’t many looming catalysts on the calendar between now and then.

Stocks maintained their gains into the close to finish the day at a new all-time high.

Time is money. Spend more time making money and less time researching markets every day. Subscribe to the 7sReport.com.

Weekly Market Cheat Sheet, September 11, 2017

Last Week in Review

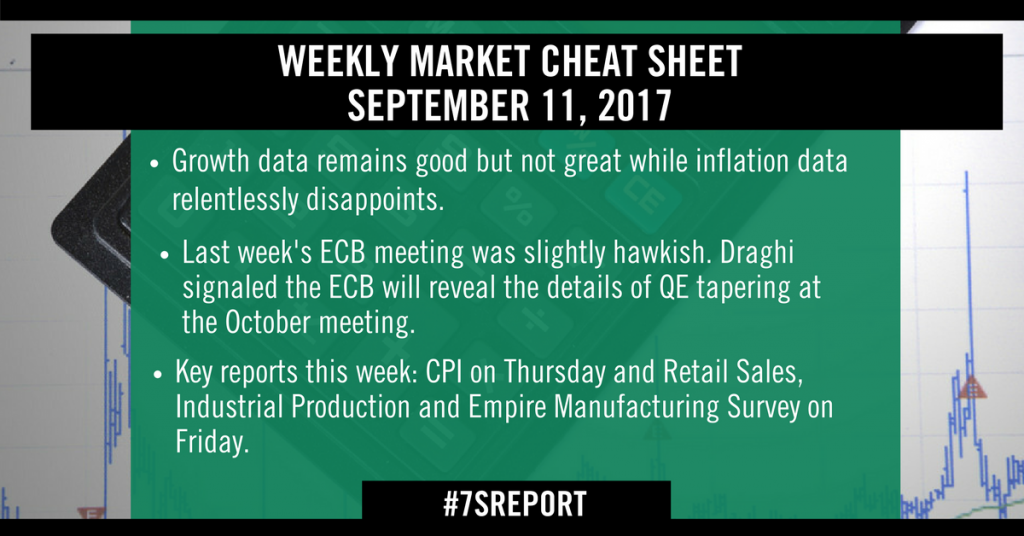
The economic data remains remarkably consistent: Growth data remains good but not great while inflation data relentlessly disappoints. From a market standpoint, that means that the economy isn’t at imminent risk of a material loss of momentum, but at the same time there are no signs of the type of acceleration that would lead to a rising tide carrying stocks higher.

From a Fed standpoint, inflation remains lackluster, and that’s causing a reduction in expectations for a December rate hike. That’s not a medium/longer-term good thing for stocks, because it further throws into doubt the chances for reflation—and economic reflation remains the key to sustainably higher stock prices.

Looking at last week’s data, there weren’t many numbers, but the numbers we got reinforced the “slow growth/low-inflation” trend.

The ISM Non-Manufacturing PMI (or service sector PMI) rose to 55.3 from 53.9. So, there was acceleration in activity in August. But that acceleration missed estimates of 55.8, and while a number in the mid-50s is solid, it’s not the type of number that implies we’re seeing real acceleration.

The other notable number last week that was largely ignored by the media was August productivity and unit labor costs. An uptick in productivity, if it’s consistent and material, could lead to an economic acceleration.

The reason for that is simple: The economy is basically at full employment. But, if those workers get more productive, the total economic output increases, and we get a stronger economy.

August productivity rose to 1.5% vs. (E) 1.3%, so that is a good sign. It’s not nearly the acceleration we need, but it’s a step in the right direction.

However, that productivity number wasn’t the important one from this release. The important number was unit labor costs. Rising unit labor costs is a precursor to larger inflation, so it’s an important number. And, unfortunately, it once again missed expectations. Unit labor costs rose 0.2% vs. (E) 0.3%, providing even more fodder for the “doves” on the Fed to not hike rates in December.

Finally, turning to the ECB meeting last week, you know by now it was slightly hawkish. Draghi signaled the ECB will reveal the details of QE tapering at the October meeting, and he again chose not to try and “talk down” the euro, which led to the euro hitting new multi-year highs (and the dollar hitting multi-year lows).

From a market standpoint, that dollar weakness is a slight tailwind on US stocks, although not a material one. Until we get better inflation or growth data here in the US, the trend of euro strength/dollar weakness will continue.

This Week’s Preview

All the important economic reports this week come out Thursday and Friday, which is nice because that gives us a bit of time to get ourselves squared away following all the hurricane issues from last week.

The most important number this week is CPI, out Thursday. As you know, inflation remains the key issue with the economy and Fed expectations. Frankly, we need CPI to start firming because it’ll give us hope of a looming economic reflation. If, however, this number disappoints, as it has for a few months, we’ll see new lows in the dollar and new lows in Treasury yields, neither of which are a good thing for stocks beyond the very short term.

After CPI, there are three important growth numbers out this Friday: Retail Sales, Industrial Production and Empire Manufacturing Survey.

Starting with the first two, remember there remains a large gap between “hard” economic data and surveys. Put plainly, actual economic data is not rising to the level that’s being implied by the PMIs and/or consumer confidence. The longer that occurs, the more likely it is that the surveys are exaggerating economic growth.

So, the sooner hard economic data begins to accelerate, the better. If retail sales and industrial production can beat estimates, that will be an economic positive.

Turning to Empire Manufacturing, that’s the first data point from September, and that’s always anecdotally important because we don’t want to see any steep drop off that might imply a loss of momentum.

Bottom line, this week gives us more color into the state of growth and inflation in August. We need to see both begin to accelerate if we are to hold out hope that we can see an economic reflation create a “rising tide” for stocks in Q4 ’17 or Q1 ’18.

Time is money. Spend more time making money and less time researching markets every day. Subscribe to the 7sReport.com.

EIA Report Analysis and Oil Update, September 8, 2017

Get the simple talking points you need to strengthen your client relationships with a free trial two-week trial of The Sevens Report.

Yesterday’s EIA report was taken with a grain of salt, as the effects of Hurricane Harvey badly skewed the data resulting in a print that was basically worthless from a fundamental analysis standpoint. As would be expected with a large number of refinery outages, crude stocks rose +4.6M bbls, but that was slightly less than estimates calling for a +5.0M build.

EIA Report Analysis and Oil Update

Meanwhile, both gasoline and heating oil inventories declined (as refineries runs were way down) by -3.2M bbls and -1.4M bbls, respectively (but both declines were smaller than expected). On balance, the headline prints were largely dismissed. WTI finished the day down 0.22% while RBOB gasoline futures fell 0.98%.

The production portion of the report was a little shocking at first glance, but at the same time, the data made sense when you consider the impact Harvey had on the Gulf Coast oil industry. Lower 48 production declined -783K b/d last week, or 94% of the 2017 output gains.

For perspective, the average weekly change coming into this week was +24K b/d. Like the headlines, the production data was largely overlooked by traders because the data was so badly skewed by Hurricane Harvey.

Looking ahead, it will be very important to watch the production data. If output does not recover in a swift manner that will be a bullish supply side development, as the relentless grind higher in US oil output has been the single-largest headwind for oil prices this year. For now, the outlook for oil is neutral with a bias to the downside, as nothing has changed materially enough to push futures through resistance between $50 and $54/barrel in WTI.

Skip the jargon, arcane details and drab statistics from in-house research, and get the simple analysis that will improve your performance. Get your free two-week trial of the Sevens Report today.

Why the Debt Ceiling Deal Isn’t a Positive for Markets, September 7, 2017

Bottom Line: Fischer & Debt Ceiling Not Market Positives

The two big news items Wednesday were the resignation of Fed Vice Chair Fischer, and the agreement on a three-month debt ceiling extension/government funding deal.

Starting with the former, Fischer’s resignation makes the Fed very slightly more dovish (Fischer was a modest hawk) but really the future path of Fed interest rates depends a lot more on inflation data than it does Fed personnel.

From a market standpoint, the odds of a December rate hike appropriately declined slightly Tuesday. But again, Fischer’s departure isn’t a dovish gamechanger, and if inflation metrics move higher between now and December we’ll still get a rate hike. From a stock standpoint, other than the temporary pop yesterday, I don’t see this news as an influence.

Turning to Washington, as usual, politicians have kicked the can down the road. On a positive note, we won’t see a debt ceiling drama or shutdown drama in late-September.

On a negative note, we likely will see an even more intense budget battle into the year-end. This will be all the more contentious because now tax cuts will be thrown into the mix, assuming Republicans have a concrete plan by then.

From a market standpoint, this is a very short-term positive in so much as it removes the possibility of a crisis over the next few weeks.

However, it sets up an even bigger potential negative into the end of the year. Bottom line, the debt ceiling/government funding agreement is not an incremental positive for markets, and we don’t expect it to push stocks higher from here.

In sum, both of Wednesday’s headlines had no real impact on our overarching macro view. We remain cautiously positive on stocks, but continue to believe that tax cuts and earnings hold the key to performance for the remainder of 2017.

Cut through the noise and understand what’s truly driving markets, as this new political and economic reality evolves. Start your free two-week trial of The Sevens Report today.


European Central Bank (ECB) Interest Rate Preview, September 6, 2017

Join hundreds of advisors from huge brokerage firms like Morgan Stanley, Merrill Lynch, Wells Fargo Advisors, Raymond James and more… see if The Sevens Report helps you make more money in less time with a free two-week trial.

The ECB is expected to signal it will begin to taper its QE program sometime in 2018 at tomorrow’s meeting; however, the details regarding that tapering announcement remain unclear.

Why It Matters: The dollar. The falling dollar, which is down more than 10% year to date, has been an under-appreciated tailwind on the stock market (a weaker dollar boosts exports and corporate profits). If the ECB is more hawkish than expected tomorrow, that will cause a potentially big reversal in the dollar. I say that, because “long euro/short dollar” is a very crowded trade at the moment, and if it reverses, it could be violent.

The reason this meeting will punch above its weight from a market standpoint is because the ECB commentary on tapering will be (correctly) taken as implicit commentary on the strength of the euro.

The market assumes that the ECB is not concerned about current euro strength. If the ECB fails to announce tapering intentions tomorrow, or is very vague about those intentions, the market will infer that the ECB thinks the euro is too high. If that happens, the euro will drop, hard, and the dollar will soar—and that will likely be a headwind on US stocks, and a (big) tailwind on European stocks (so HEDJ will begin to rally again).

Meeting Expectations If: ECB President Draghi confirms, at the press conference, that the ECB Governing Council intends to taper QE in 2018, and that it will reveal details of that plan at a future ECB meeting. So, Draghi announces tapering is coming, but doesn’t give any details.

Dovish If: Draghi does not announce the intention to being tapering QE sometime in 2018. This is a remote possibility, but given the strength in the euro I don’t want to completely rule it out.

Mildly Dovish If: Draghi announces that the ECB intends to taper QE, and that it will announce the details at the December meeting, at earliest. Draghi likely won’t single out December, but he won’t say details will be revealed at the “next” meeting, which would be October.

Hawkish If: Draghi announces that the ECB intends to taper QE, and says the details of the taper will be revealed at the “next” meeting. That’s the key phrase to watch for. If that’s the case, look for the euro to modestly rally as there is not clear consensus on an October reveal, and that would be taken to interpret urgency on the part of the ECB, and a disregard for the strength in the euro. It’s the latter point that would cause the euro to rally.

Finally, I don’t want to say that something is impossible, but it’s incredibly unlikely that Draghi and the ECB will reveal detailed plans regarding the tapering of QE tomorrow. The wide consensus will only be to announce they want to start tapering QE.

The Sevens Report is everything you need to know about the markets in your inbox by 7am, in 7 minutes or less. Start your free two-week trial today and see what a difference the Sevens Report can make.

3 Catalysts for the Market, Plus a Wildcard to Watch, September 5, 2017

The Sevens Report is everything you need to know about the markets, in your inbox by 7am in 7 minutes or less. Claim your free two-week trial today.

Ever since I started my career I’ve viewed the post Labor Day time in the market as the “make or break” period of the year—because I’ve found the September-December months provide an inordinate share of both risks and opportunities for portfolios… and I believe this year will be no different.

So, as we start this “stretch run” into the end of the year, the current market set up remains as follows: Stocks have had a great year from a return standpoint, and momentum and the benefit of the doubt remain with the bulls. Yet at the same time, cracks are appearing in this Teflon market, and as such I view the market as being at much more of a tipping point than most analysts.

I believe we will either get the positive catalysts that will send stocks higher between now and year end, or the forces that have powered stocks higher throughout 2017 (earnings growth, momentum) will begin to recede, potentially opening an “air pocket” like we saw in August 2015 and early 2016.

I want to spend time today focusing on the key catalysts that I believe will decide whether the market extends the 2017 gains between now and year end, or whether we see a pullback.

But before I go into these catalysts, with regards to the weekend’s news, it goes without saying that a military conflict with North Korea is a near-term bearish gamechanger.

To be clear, I do not think that it will happen, but at the same time the level of tension here is rising considerably. If there is a military strike against North Korea, reducing tactical positions will be prudent, and it’s one reason why I continue to advocate buying puts on the Nasdaq or Russell with September or October expirations.

Away from North Korea, the catalysts that, in our opinion, will make or break 2017 are: Tax cuts, earnings, and the ECB/Fed decisions.

3 market catalysts to watch

Catalyst 1: Tax Cuts. Why This Matters—It Could Spark Another 5% Rally (Easily). Tax cut disappointment is a risk to the markets, but in reality, the likely market implications for the tax cut issue are either 1) Nothing, or 2) Positive.

I say that for a simple reason… the market is expecting very little in the way of tax cuts (28% corporate rate, foreign profit repatriation). So, it’ll take literally no change to the tax code to really disappoint markets and cause a tax cut related pullback. Conversely, the market has not priced in 25% (or lower) corporate tax rates and aggressive foreign profit repatriation. If that happens, expected 2018 S&P 500 EPS will rise immediately to $145/share (conservatively), which should allow the S&P 500 to rally close to 5% and still not breach 18X 2018 earnings.

Key Dates: There needs to be a formal bill introduced into one of the chambers of Congress by mid-October if we’re going to get something done by early 2018. If there’s no bill by then, look for stocks to be mildly disappointed. If there’s nothing by year end, look for it to be a headwind.

Catalyst 2: Earnings. Why This Matters—It Could Make the Market Too Expensive on a Valuation Basis. The 2017 earnings estimate for the S&P 500 is about $131/share. The 2018 S&P 500 earnings estimate is $140/ share. That’s about 7% yoy earnings growth—so that’s accounted for the vast majority of the S&P 500’s 10% YTD return.

But, there are some early signs that the growth rate of earnings is starting to peak. More specifically, a good Q2 earnings season failed to spark much of a rally in the market, so if Q3 earnings disappoint (even a little bit) that could cause some concern about that $140 2018 S&P 500 EPS, and investors might begin to book profits, which could easily snowball given extended valuations.

Key Dates: Oct. 9. That’s the unofficial start of Q3 earnings season (the big banks report that week).

Catalysts 3: Fed/ECB. Why This Matters—The Dollar. The ECB decision on the announcement of tapering (which will come this Thursday), and the Fed’s commentary at the meeting on Sept. 20, will be important for the markets for one main reason—currencies.

The Dollar Index is near multi-year lows on the expectation of ECB tapering, and that’s been an unsung tailwind on the markets so far in 2017. But, if the ECB surprises this Thursday and doesn’t announce its intention to taper QE starting in 2018, the dollar will surge and the euro will drop, and that could be a surprise headwind on U.S. stocks.

Additionally, since July the market has largely convinced itself that the Fed won’t hike rates in December, but it’s important to realize that Fed leadership (Yellen, Dudley, Fisher) haven’t really confirmed that expectation. If economic data gets better between now and then, even with low inflation, the market could have to price in another rate hike, which could also be a near-term head-wind.

Key Dates: Sept. 7 (ECB Meeting), Sept. 20 (FOMC meeting).

Wildcard to Watch: Withheld for subscribers. Unlock with a free two-week trial subscription to the Sevens Report.

Jobs Report Preview, August 31, 2017

The Sevens Report is everything you need to know about the markets in your inbox by 7am, in 7 minutes or less. Start your free two-week trial today and see what a difference the Sevens Report can make.

Before getting into this month’s jobs report preview, I want to point out that August jobs reports have a history of being the worst reports of the year, and often provide negative surprises. The reason why isn’t exactly clear. It likely has to do with the resumption of college and end of summer jobs, although that’s never been statistically verified. The reason I’m telling you this is because if there’s one month where a soft jobs report is at least partially overlooked, it’s August. Point being, a soft jobs report tomorrow won’t be as “dovish” as a soft jobs re- port any other month.

Bigger picture, the inflation component of this report remains key. A December rate hike isn’t certain, but if wages tick higher and the headline number is strong, that will push yields and the dollar higher, and stocks likely lower (at least in the short term). Longer term, though, we need a “reflation,” and that comes with better growth and inflation, so that’s the preferred outcome for anyone with a longer-term time horizon (which is all of us, I suspect).

“Too Hot” Scenario (A December Rate Hike Becomes More Certain)
>250k Job Adds, < 4.1% Unemployment, > 2.8% YOY wage increase. A number this hot will refute the lower inflation numbers and reintroduce the potential for a “not dovish” Fed. Likely Market Reaction: We should see a powerful re-engagement…withheld for subscribers only—unlock specifics and ETFs by signing up for a free two-week trial).

“Just Right” Scenario (Leaves a December Rate Hike As A 50/50 Proposition)
125k–250k Job Adds, > 4.2% Unemployment Rate, 2.5%-2.8% YOY wage increase. This is the best-case scenario for stocks, as it would reinforce the current expectation of balance sheet reduction in September, and (maybe) one more 25-bps rate hike in December. Likely Market Reaction: A knee-jerk, mild stock rally..withheld for subscribers only—unlock specifics and ETFs by signing up for a free two-week trial).

“Too Cold” Scenario (Economic Growth Potentially Stalling)
< 100k Job Adds, < 2.5% YOY Wage Gains. If we see a big disappointment in the jobs number and a further softening of wage inflation, that will send bond yields lower, but it would also likely weigh on stocks as it will raise concerns about economic growth. Likely Market Reaction: Bonds and gold should surge and the 10-year Treasury yield would…withheld for subscribers only—unlock specifics and ETFs by signing up for a free two-week trial).

Time is money. Spend more time making money and less time researching markets every day. Subscribe to the 7sReport.com.

Shutdown vs. Debt Ceiling, August 30, 2017

The Sevens Report is everything you need to know about the markets in your inbox by 7am, in 7 minutes or less. Start your free two-week trial today—see what a difference the Sevens Report can make.

Washington will be at the epicenter of markets in September, and for four reasons: Progress (or lack thereof) on tax cuts, Fed balance sheet reduction, debt ceiling increase and government shutdown. I’ve covered the first two in the Report at length, but I haven’t spent a lot of time on the latter two events.

And, once media coverage moves on from the tragedy of Hurricane Harvey, as it undoubtedly will shortly, it will refocus on Washington, and specifically the debt ceiling and government shutdown, as both are coming up fast.

The shutdown and debt ceiling fight have the potential to cause a pullback in stocks, and both will undoubtedly be referenced by scary headlines on the financial media.

In reality, the chances of either event actually hitting stocks is low, and I want to spend a few minutes to give you the “need to know” on each event, and what needs to happen for either event to push stocks lower.

Government Shutdown Deadline Dates: September 30th. Why It’s A Potential Problem: The border wall. What Needs To Happen: Congress must pass a budget by that date or begin to close non-essential government services. Last Time It Happened: 2013. Will It Cause A Pullback? Almost certainly not.

The fight here seems to revolve around Trump’s border wall. The president wants funding for the wall included in the budget, but Democrats have vowed to vote against any budget that includes the border wall.

That stalemate could cause a shutdown as Republicans would have to vote as a block to pass the budget over Democrat opposition, and that’s just not something that’s likely to happen.

What Likely Happens: September 30th isn’t a hard deadline, as Congress can pass short-term “continuing resolutions” to keep the government funded and open while the negotiations get settled. Probability of a Shutdown: 20%.

Debt Ceiling. Deadline Date(s): September 30th, midOctober. Why It’s a Potential Problem: Because it’s Washington, and they can’t do anything easily (at least not so far). What Needs to Happen: Congress must pass a debt limit extension by the deadline. Last Time It Happened: Never. The government has never failed to raise the debt ceiling, although there was a big scare in 2011 that spooked markets. Will It Cause A Pullback? Almost certainly not.

There isn’t any specific issue that could cause the debt ceiling to not be extended, but again, it’s Washington—so nearly anything is possible.

What Likely Happens: Of the two issues (government shutdown and debt ceiling) the debt ceiling is the much more serious one, because there isn’t the ability to kick the can down the road like there is with funding the government (i.e. no short-term extensions). So, I’d expect the debt ceiling will be raised with (relatively) little drama. Probability of a Default (i.e. not raising the debt ceiling): 15% (and that’s probably a mild over estimation).

Bottom Line
These two events will dominate headlines in the coming weeks, but a cold, unemotional look at the facts strongly suggest these are not going to be material headwinds on the markets this fall.

Progress (or not) on tax cuts, earnings, economic data and geopolitical dramas are the major threats to this 2017 rally as we enter the stretch run into year end.

The Sevens Report is the daily market cheat sheet our subscribers use to keep up on markets, seize opportunities, avoid risks and get more assets.

Harvey’s Market Impact, August 29, 2017

The Sevens Report is everything you need to know about the markets in your inbox by 7am, in 7 minutes or less. Start your free two-week trial today and see what a difference the Sevens Report can make.

We got a couple of questions from advisors yesterday about the market impact of Hurricane Harvey, so I imagined you might be getting similar calls from your clients.

So, I wanted to clearly and briefly outline the market impact of the storm.

Macro Impact: Not Much. From a macro standpoint (Fed policy, GDP growth, inflation) Hurricane Harvey won’t have much of an effect. While clearly a significant human tragedy for Houston and Southeast Texas, storms simply don’t have a lasting effect on markets. Katrina and Sandy had impacts on the local economies, but again, the broader macro influence wasn’t big. Harvey does not change our “cautiously positive” stance on markets.

Micro Impact: The more palpable impact of Hurricane Harvey will be on specific market sectors, although I will not provide a list of “winners” given the damage wrought upon Houston and other parts of Texas.

That said, companies that likely will see increased demand due to the storm are: Refiners (HFC, DK), trucking companies (KNX), and equipment rental companies (URI). Unfortunately, there’s not a clean ETF for these sectors, and the only tradeable infrastructure ETF is a global ETF, so I don’t think it’s applicable here.

Companies that are likely to see business decline because of Harvey are: Natural gas and oil E&P companies due to a lower production and lower prices (ETF is XOP), and insurers.

Looking at insurers, the focus there is on property and casualty insurers as they will be the most affected by the storm. The big insurance ETF is KIE which traded down 1% on the news yesterday. But, while the first instinct would be to run from the insurance space, in some ways I view this as a potential opportunity to buy insurers on a dip (if this continues).

First, property and casualty insurers are just 40% of KIE. Yes, there will be more exposure through reinsurance (10.8% of assets), but that still leaves about half the assets of the ETF somewhat insulated from the storm. Additionally, 24% of the exposure of the fund is to the UK, and those should have little exposure to Harvey.

Point being, I’m not saying buy KIE today but I also want to look through the initial impulse to just shy away from the sector entirely. But, over the longer term, being long insurance companies are like betting with the house in a casino—they always win given enough time.

If Harvey creates an unreasonable downdraft in KIE, we will likely allocate capital to it for longer-term accounts. We’ll be watching this one going forward.

Time is money. Spend more time making money and less time researching markets every day. Subscribe to the 7sReport.com.

Weekly Market Cheat Sheet, August 28, 2017

Last Week in Review

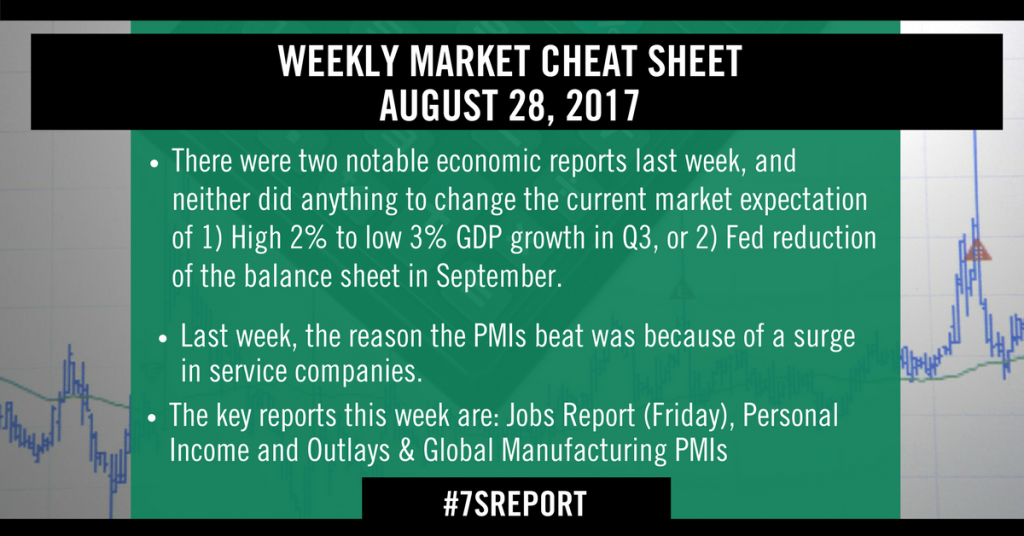
There were only two notable economic reports last week, and neither were particularly controversial… and neither did anything to change the current market expectation of 1) High 2% to low 3% GDP growth in Q3, or 2) Fed reduction of the balance sheet in September.

Neither data point gave us any incremental color on whether the Fed will hike rates in December, although
we’ll get a lot more color on that issue this week. Looking at the data, the most important number last week was the August flash composite PMIs. The headline number beat at 56 vs. (E) 54.3, but that strong aggregate number hid some pretty significant discrepancies in the details.

The reason the PMIs beat was because of a surge in service companies. Flash service sector PMI rose to 56.9 vs. 54.8. But, the more important manufacturing PMI dropped to 52.5 vs. 53.2 (the manufacturing PMI is just a better reading of activity, so it’s more heavily weighted in the minds of economists).

So, despite the headline beat, this number was actually a disappointment, although I want to be clear that it was not an outright negative (PMIs need to drop below 50 before they imply economic activity is slowing). Bottom line, this is not the type of August reading that would make us think we’re seeing an economic acceleration.

Turning to Durable Goods, they were in line. Yes, the headline reading missed expectations as orders for Durable Goods fell -6.8% vs. (E) -5.8%. But, longer-time readers of this Report know you should ignore the headline as it’s massively skewed by airplane orders. The more important number is New Orders for Non-Defense Capital Goods ex Aircraft (NDCGXA) and it rose 0.4% vs. (E) 0.5%, although June data was revised 0.1% higher, so it was an in-line reading.

Again, we watch NDCGXA because it’s the best proxy for business spending and investment. And, similar to the flash PMI, while the number isn’t an outright negative, it’s not the kind of number that makes us think a broad economic acceleration is coming.

Bottom line, both numbers last week implied continued steady, but unspectacular, economic growth, and that’s simply not enough to cause a rising.

This Week’s Preview

This will be one of the busiest weeks of the year from an economic data standpoint, and it will come during one of the lowest liquidity weeks of the year… so the potential for data-based volatility this week is high.

The key reports this week (in order of importance) are: Jobs Report (Friday), Personal Income and Outlays (Thursday) and Global Manufacturing PMIs (Thursday night/Friday morning).

The reason those reports are ranked like that is because of inflation. Remember, barring a shockingly week Jobs Report on Friday, nothing is going to stop the Fed from reducing the balance sheet in September.

But, whether they hike rates in December remains uncertain, and the key variable that will decide that is inflation. So, that means that the wage number in Friday’s Jobs Report, and the Core PCE Price Index (the Fed’s preferred measure of inflation, which is contained in the Personal Income and Outlays report) will be the two key numbers this week.

If they run hotter than expected, you will see markets begin to price in the chance of a December rate hike, which would likely be a near-term headwind on stocks as a rate hike is not priced in to bond yields, the dollar or equities.

Turning to measures of economic growth, the August manufacturing PMIs are always important, but again there really shouldn’t be any major surprises here. A firm number in the US that refuted the soft flash PMI from last week would be welcomed as we need better growth to push stocks higher, but really the focus will be on inflation this week.

Looking at the dovish possibilities, we could easily see the data this week push the 10-year Treasury yield to new lows if the inflation data is underwhelming, and we would view that as a negative for stocks broadly.

Bottom line, I know this is a heavy vacation week, but it’s important one for Fed and ECB expectations, and that has the potential to move markets, especially given the precarious technical situation the S&P 500 is sitting in.

Time is money. Spend more time making money and less time researching markets every day. Subscribe to the 7sReport.com.