U.S. & China Trade Progress?

What’s in Today’s Report:

  • Weekly Market Preview (Important Trade News & Earnings This Week)
  • Weekly Economic Cheat Sheet

Futures are slightly higher on continued momentum from Friday’s rally following a quiet weekend.

Markets rose on Friday thanks to a WSJ article stating the U.S. & China want a trade compromise by November, and nothing this weekend disputed that report.  So, cautious optimism is building a deal might get done.

Outside of the trade news the weekend was quiet.  Turkey remains a problem (lira down 1%) but there was no, new negative news out.

Today there are no economic reports and only one Fed speaker, Bostic (11:00 a.m.).

So, markets will stay focused on 1) Trade headlines, 2) The dollar and 3) the tech sector.  Trade should stay quiet into the U.S./China meetings Wed/Thursday.  The dollar is bouncing from Friday’s declines and sustained dollar weakness remains the biggest key to a breakout in stocks, so any weakness there will be welcomed by investors.  Finally, tech needs to remain stable in this environment so support stocks, and the price action there lately hasn’t been encouraging.

To read the full article: Go Here

Worried About Tech

What’s in Today’s Report:

  • Why the Turkish Crisis Isn’t Over
  • Focus on the Tech Sector (It’s Trading Heavy Again)

Futures are slightly lower thanks to a renewed decline in the Turkish lira and disappointing tech earnings.

The lira decline resumed overnight as the currency fell 5% after Thursday’s press conference failed to reveal any meaningful reforms.

On the earnings front, both AMAT and NVDA posted solid results but underwhelming guidance, and that’s weighing on tech broadly.

Today we do have two economic reports, Consumer Sentiment (E: 97.9) and Leading Indicators (E: 0.4%), but focus will remain on 1) the tech sector and 2) the dollar.  If tech can stay stable despite recent soft earnings, and the dollar doesn’t rally, then stocks can generally hold yesterday’s gains.

To access the full report: Go Here

Updated Market Outlook: Good, Bad & Ugly

What’s in Today’s Report:

  • Updated Scenario Analysis:  Good, Bad & Ugly
  • EIA Analysis & Oil Update

Futures are enjoying a modest bounce thanks to some mild progress on U.S./China trade and good CSCO earnings.

The WSJ reported a mild “breakthrough” occurred on U.S./China trade and low level talks will begin again shortly.  It’s not major progress, but it is the first positive motion we’ve seen on the issue in months, so that is welcomed news.

On earnings, CSCO posted strong numbers after the bell and that should help support tech and tech remains, easily, the most important sector for the broad market right now (a lot of yesterday’s selling was about tech weakness, not Turkey).

Economically, UK Retail Sales beat estimates (0.7% vs. (E) 0.2%) as European related growth this week remains good.

Today focus will remain on the geo-political (progress in Turkey?) and on U.S. economic data.   Philadelphia Fed Outlook Survey (E: 22.5) is the most important report today, but we also get Housing Starts (E: 1.271M), Jobless Claims (E: 215K).

Bottom line, if the dollar declines and tech leads the rally, then the S&P 500 can recoup yesterday’s losses.

To read the entire report Go Here

Is the Turkey Crisis Over?

What’s in Today’s Report:

  • Is the Turkish Currency Crisis Resolved?
  • Chinese Economic Data Recap (July)
  • Is Copper Forecasting an August-2015-Style Volatility Spike?

Futures and most international markets traded lower overnight as contagion fears from Turkey’s currency crisis persist despite further gains in the lira.

Indonesia unexpectedly raised rates o/n to combat the “contagion effect” that is weighing on EM currencies, the second central bank to do so in the last week.

There was no market moving economic data o/n but the American Petroleum Institute’s weekly inventory report was bearish late Tuesday, leading to declines of more than 1% in oil prices this morning.

Looking ahead to the US session, there are a slew of economic reports due out this morning: Retail Sales (E: 0.1%), Empire State Manufacturing Survey (E: 20.0), Industrial Production (E: 0.3%), and Housing Market Index (E: 68) that will be in focus early.

There are no Fed officials speaking today, so aside from the data, focus will be on relations with Turkey and the ongoing EM currency contagion concerns.

So far, the Lira’s rebound from all time lows has been tentative at best, so renewed weakness in the Turkish currency could hit stocks today.

To access the entire article – Go Here!

Six Charts That Explain This Market from the Sevens Report

The Sevens Report is everything you need to know about the markets, in your inbox before 7am, in 7 minutes or less. Sign up now and get a free two-week trial.

Below you’ll find six charts, spanning asset classes and economic data.

The charts are divided up into two groups.

Group 1 is comprised of four charts that explain why stocks have rallied so nicely in 2017, and why, in the near term, the trend in markets is still higher.

Group 2 is comprised of two charts that look into the future, and show that despite a bullish set up right now, there are real, serious reasons to be worried about how long this rally can last. Point being, these indicators are telling you not to be complacent!

Group 1: Why Stocks Have Rallied

Chart 1:  Economic Data 

Chart 2:  Earnings Growth  

Earnings and Economic Data – The Unsung Heroes of 2017

We have said since the early summer that an acceleration in economic data and earnings growth have been the unsung heroes of the 2017 rally.

And, as long as both of these factors continue to trend higher, that will underpin a continued rise in U.S. stocks, regardless of noise from Washington, North Korea, Russia, etc.

Chart 3:  S&P 500 

The Trend Is Your Friend

The trend in stocks has been relentlessly higher since early in 2016, and the S&P 500 has held that trend line through multiple tests.

Bottom line, the technical outlook on this market remains powerfully positive.

Chart 4:  Commodities (Oil & Copper)

There are few better indicators of global economic growth than industrial commodities, and two or the most important (oil and copper) have been telling us for months that global growth is accelerating.

And, as long as oil and copper are grinding to new highs, that will be a tailwind not just on U.S. stocks, but on global stocks as well.

Group 2:  Risks to This Rally

While the four charts above explain why stocks have rallied and why the outlook remains, broadly, positive, there are still risks to this rally and this market.

Don’t be fooled into being complacent with risk management, because while trends in U.S. and economic growth, earnings and the stock market are all still higher, there are warning signs looming on the horizon.

Chart 5:  Inflation (Warning Sign #1)

Non-Confirmation: Why Isn’t Inflation Rising?

Inflation remains inexplicably low, considering that we’re near full employment and global economic growth is accelerating.

And, accelerating inflation remains the missing piece of a true “Reflation Rally” that can carry stocks 10%, 15% or even 20% higher over the coming quarters and years.

But, it’s not just about missed opportunity.

The lack of inflation is a big “non-confirmation” signal on this whole 2017 rally, and if we do not see inflation start to rise, and soon, that will be a major warning sign for stocks, because…

Chart 6: The Yield Curve – Will It Invert?

Yield Curve: Sending a Warning Signal? 

If the outlook for stocks is so positive, then why did the yield curve (represented here by the 10’s – 2’s Treasury yield spread) equal 2017 lows on Wednesday?

Simply put, if we’re seeing accelerating economic growth, rising earnings, potential tax cuts and all these other positive market events, the yield curve should be steepening, not flattening.

So, if this 10’s – 2’s spread continues to decline, and turns negative (inverts) then that will be a sign that investors need to begin to exit the stock market, because a serious recession is looming, and the Fed won’t have much ammunition to fight it.

If I was stuck on a desert island (with an internet connection and access to my trading accounts of course) and could only have one indicator to watch to tell me when to reduce exposure in the markets, this 10’s – 2’s spread would be it – and it’s not sending positive signals for 2018!

“Should I buy more stocks because tax cuts are coming?”

“Should I buy more stocks because tax cuts are coming?”

I was asked that question three separate times this weekend at the local pumpkin patch, while my kids were running around grabbing pumpkins.

And, honestly, it’s a legitimate question, because on Friday stocks shot to new highs on rising investor optimism for tax cuts (at least, that’s what the financial media said).

But, here’s the problem: The answer to the question is… “No.” 

In fact, tax cuts pose more of a risk to stocks than they present an opportunity.

That’s because the outlook for tax cuts didn’t improve last week. In fact, it probably got worse.

But, as usual, that’s hard to discern through all the market and financial media “noise.”

Here’s what I mean:

Stocks rallied on Friday after the Senate passed a budget resolution that, potentially, paves the way for tax cuts.

But, as I said to paid subscribers in today’s Sevens Report:

“The market rallied on the passage of the budget resolution in the Senate last week, but that’s the equivalent of cheering because your team’s bus made it to the stadium for the game.”

That analogy prompted some great response from advisor subscribers:

“Hi Tom!  I really enjoy your analogies in breaking down industry jargon…and this has to be one of my favorites, in terms of you describing the budget resolution being passed.”  – A.L. Financial Advisor in Cleveland, OH.

Point being, last week’s vote, which was the catalyst for the Friday rally, didn’t improve the chances of tax cuts passing at all – it merely removed the prospect of spectacular failure!

But, the important truth is that right now, we should be more worried about tax cuts failing and causing a correction late this year, because tax cuts are already priced into the markets (I show you why below).

More broadly, is your subscription research breaking down the daily jargon and giving you explanations and analogies that help you impress clients?

Case in point, in Monday’s issue we told subscribers that Friday’s rally was misguided, so it didn’t surprise us, or our subscribers, that markets gave back those gains on Monday.

I created the Sevens Report because I know that most financial advisors and professionals are not glued to blinking screens from 9:00 – 4:00 each day.

They are discussing the financial goals of their clients and mapping a course to reach those goals.  Most of their time is spent building and fostering relationships, not analyzing Fed commentary, studying the yield curve, or digging through an oil inventory report.

Every trading day, at 7 a.m., we email our subscribers their morning Report, which contains the information they need to show their clients they are on top of the markets with a plan to outperform, regardless of the environment. And, our research continues to help our subscribers grow their businesses!

“Let me know if there is anything else that you need from us. Thanks again for everything. I really enjoy the Report – it is helping me grow my business and stay on top of things.” –  D.M. Registered Independent Advisor.

Anticipation of tax cuts has once again become a major contributor to the recent rally in stocks, and at these levels I can confidently say that tax cuts are now priced into the market, so there is risk of a disappointment later in 2017 or early 2018. 

Given that, I want to make sure everyone is aware of 1) Where we are in the tax cut process, 2) What major hurdles remain and 3) How much stocks could pullback if tax cuts fail.

I’ve included an excerpt of that research below as a courtesy.

Sevens Report Excerpt: Tax Cut Update

Where Are We on Taxes? Answer: Not Very Close. I want to be clear here: The market rallied on the passage of the budget resolution in the Senate last week, but that’s the equivalent of cheering because your team bus made it to the stadium for the game.

The budget resolution (which will pass the House later this week) is a necessary step to even begin to discuss tax reform. It has little-to-no bearing on whether tax cuts will actually get passed. In fact, it’s pretty disheartening that it was so close in the Senate at 51-49. This was not reason for optimism.

What major hurdles remain? Answer: SALTs. The major hurdle with tax cuts now is how does Congress pay for them? If Congress is going to cut taxes, they must offset the reduced revenue by increasing taxes elsewhere (simply reducing government spending is out of the question).

Early in 2017, the idea on how to pay for tax cuts was “BATs,” or Border Adjustment Taxes. Basically, that would put a “value-add tax” on imported goods like they have in Europe, and that would offset the corporate tax cuts (I’m over simplifying for effect, but you get the idea).

Businesses pushed back on that idea big time because most American companies buy the raw materials or manufacture their products overseas, so that would be a big tax increase for them. So, BATS died.

Now, we’ve moved in to SALTs. SALTs stands for “State and Local Taxes,” or more specifically, removing the ability for taxpayers to deduct state and local taxes against their federal income taxes.

But, as you can imagine, people in high-tax states like New York, Connecticut, Massachusetts, California, etc., don’t like this idea at all, so it has met with some serious opposition. Bottom line, Republicans need to find a compromise on SALTs otherwise the tax cuts will likely significantly add to the deficit, and they won’t have the votes to pass the Senate.

That is the No. 1 issue in the tax cut fight, and it’s a very big (and difficult) one. 

Until the SALTs issue is resolved, the outlook for tax cuts is neutral at best (despite market anticipation). And, if SALTs die the same death as BATs, then the outlook for any tax cuts is outright dire—and that’s a risk to markets.

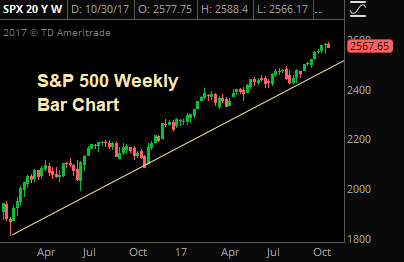
How much stocks could pullback if tax cuts fail? Answer: At least 5%. Here’s how I get to that number. For the last two-plus years (up until the September melt up this year) the S&P 500 has traded between 17X and 17.5X next year’s earnings. But, due to the recent melt up, the S&P 500 currently trades at nearly 18.3X the 2018, $140/share S&P 500 EPS.

If we believe the market still wants to trade at about 17.5X earnings, that means the market is pricing in $147/share for the S&P 500 for 2018, or about $7 more than the consensus.

I feel confident saying that all of that $7.00 is anticipation of tax cuts, because frankly there isn’t much else that can explain it (and it makes sense because consensus is for an additional $4-$10 dollars in S&P 500 EPS if substantial tax cuts are passed).

Point being, if the outlook for tax cuts dims between now and year end (and this is entirely possible despite current optimism) then we could easily see the S&P 500 drop to that $140 2018 S&P 500 EPS times 17.5 (the long-standing market multiple), and that equals 2450, or 110 points (about 5%) lower from current levels—and that’s assuming no additional negative surprises.

Bottom line, at this point, I feel safe saying that corporate tax cuts are at least partially priced into the market, and that’s important given the neutral outlook for tax cuts.

Dow Theory Update, October 17, 2017

Join hundreds of advisors from huge brokerage firms like Morgan Stanley, Merrill Lynch, Wells Fargo Advisors, Raymond James and more… see if The Sevens Report is right for you with a free two-week trial.

Charles Dow’s famous (but simple) theory for stock market investing is based on a series of higher highs and higher lows registered by both the Dow Jones Industrial Average and Dow Jones Transportation Average, indicating bull market conditions. On the contrary, as soon as a set of lower lows and lower highs have been registered by both of the aforementioned indexes, the theory indicates bear-market conditions are likely.

Over time, investors have applied the tenets of Dow Theory to a wide range of time frames from intraday
charts to monthly bar charts. The success rate, number of trades, and maximum drawdowns vary from time frame to time frame, but for now, it doesn’t matter whether you are looking at a 15-minute chart or a
monthly chart; Dow Theory is bullish.

Starting with the industrials, the index just made new highs yesterday, and most recently made “higher lows” back in late September (on a faster time frame). That leaves a cushion of almost 1000 points in the Dow before the “faster” Dow Theory practitioners begin sounding the bearish alarm.

The Dow Transports, on the other hand, have been trading a little heavier over the last few sessions, but most recently made new highs last Friday. And while the Transports could very well break down further (as momentum has been decidedly bearish near term (over the last two sessions), but the recent new high leaves a still-bullish signal in the lesser-followed index.

Bottom line, a potential breakdown in the Transports in the weeks or months ahead would be notable, but because of the recent moves to new highs in both Transports and the Industrials, and the clear upside momentum still in the Industrials, the oldest technical theory on the financial markets continues to suggest the path of least resistance is higher—and that stock investors should continue to hold long positions.

Time is money. Spend more time making money and less time researching markets every day. Subscribe to the 7sReport.com.

Weekly Market Preview, October 16, 2017

Last Week in Review

The major takeaway from last week was that inflation remained stubbornly low in September and that took some of the momentum out of the recent reflation rebound. A decent retail sales number helped salvage the week’s economic data in aggregate, so the fallout for stocks was contained.

From a longer-term view, the fact that inflation remains stubbornly low does undermine the economic reflation that is needed to carry stocks materially higher, given valuations and the economic outlook.

Bottom line, last week wasn’t a particularly good one for the macro bulls, but given retail sales, it didn’t warrant a reversal of the September rally, either.

Looking at the important economic data from last week, there are really only two numbers of consequence: CPI and Retail Sales. The former was a disappointment, as the headline rose 0.5% vs. (E) 0.6% thanks to a hurricane-related surge in energy prices. Core CPI rose just 0.1% vs. (E) 0.2%, and the year-over-year Core CPI declined to 1.7% from 1.8%.

That’s well below the Fed’s 2% stated goal (and given how CPI is constructed, the real CPI goal for the Fed is probably more than 2.5%). So, the Fed still is not creating the type of statistical inflation it wants to.

While the inflation data was disappointing, the growth data on Friday was good. September retail sales were light on the headline at 1.6% vs. (E) 1.8%, but that was because of a dip in auto sales. The more important “control” group, which is retail sales less autos, gas and building supplies (it gives us the best
look at truly discretionary consumer spending), rose 0.4% vs. (E) 0.2%. Importantly, the August core Retail Sales reading was revised to 0.2% from flat.

Looking elsewhere economically last week, there were other reports (NFIB, Chinese Trade Balance, European IP), but none provided any big surprises and none will influence the next direction for stocks or bonds. Bottom line, taken in aggregate (and thanks to retail sales) the economic data last week was close enough to “Goldilocks” to prevent a reversal of the September rally.

From a Fed standpoint, the data this week coupled with some dovish Fed comments turned a December rate hike from a “sure thing” to a “probably,” unless we get more soft inflation or growth readings. That helped push stocks slightly higher on Friday initially, but a Fed that can’t hike rates to 1.5% from 1.25% for fear of low inflation or economic growth isn’t the prescription to materially higher stock prices.

This Week’s Preview

There are a lot of anecdotal economic reports this week that, when taken in aggregate, should give us decent insight into the current state of the US economy, and whether we’re seeing growth accelerate.

The most important numbers this week are the Empire Manufacturing and Philly Fed Indices, which offer the first look at October economic activity. Since the creation of the national flash PMIs, Empire and Philly have lost some of their significance, but this week they are the only October data points, so they’ll be watched to see if economic momentum in September carried over into October.

Away from Empire and Philly, the next more important releases come from China. On Thursday, we get Chinese Fixed Asset Investment, Retail Sales, Industrial Production and GDP. None of these should offer any surprises, but if they are weaker than expected that could cause a mild headwind on stocks.

Finally, this week we get September Industrial Production. Remember, “hard” economic data has, until very recently, badly lagged “soft” survey-based data. In September, retail sales helped close that gap some, but industrial production has remained well below levels you would think given the PMIs. If industrial production can accelerate in September (and remember the key is the manufacturing sub-component), then that will be a good signal that actual economic activity is finally accelerating to meet survey data (a positive for stocks).

Time is money. Spend more time making money and less time researching markets every day. Subscribe to the 7sReport.com.

CPI Preview, October 13, 2017

The Sevens Report is the daily market cheat sheet our subscribers use to keep up on markets, leading indicators, seize opportunities, avoid risks and get more assets. Get a free two-week trial with no obligation, just tell us where to send it.

Looking to today’s CPI report, the preference here is for a slightly “Too Hot” number in headline and core CPI while a worst case scenario for stocks is a soft number, but keep in mind there will be impacts from the Hurricanes so the details in the report will be important.

Bottom line, I’ve said consistently for months that the only way I can see stocks moving materially higher is if they are driven by a reflationary rally. We got a glimpse of that in September, but for the reflation rally to continue, we need more Goldilocks data starting with today’s CPI.

Disconcertingly, if we don’t get that Goldilocks data, then the onus is going to be totally on earnings season to support stocks, and ensure this September rally doesn’t reverse. In that scenario, it’s an awful lot of pressure to put on continued growth in corporate earnings this late in an economic cycle.

Cut through the noise and understand what’s truly driving markets, as this new political and economic reality evolves. The Sevens Report is the daily market cheat sheet our subscribers use to keep up on markets, seize opportunities, avoid risks and get more assets. Sign up for your free two-week trial today and see the difference 7 minutes can make. 

Reflation Pause- Part 2, October 11, 2017

The Sevens Report is the daily market cheat sheet our subscribers use to keep up on markets, leading indicators, seize opportunities, avoid risks and get more assets. Get a free two-week trial with no obligation, just tell us where to send it.

Reflation Update Part 2—Why This Reflation Is Different

In Wednesday’s Report, we covered why the reflation trade that started again in early September has taken a pause, and the reasons are twofold.

First, the market is unclear about who the next Fed chair will be. If it’s Kevin Warsh, that will be a “hawkish” surprise and rates could rise too quickly to keep this reflation “virtuous.”

Second, it’s unclear if upcoming central bank meetings, which means primarily the ECB but secondarily the Bank of England, will be Goldilocks. If either bank is more hawkish than the market expects it could send global rates sharply higher, causing a
pullback in the broad market.

Conversely, if either bank expresses doubts about growth or inflation, it could undercut the whole reflation idea that’s propelled stocks higher.

Point being, there are some key events that need to be resolved before the reflation trade can move higher. And, frankly, that makes this 2017 version of the reflation trade unique compared to previous economic reflations, most recently from ‘03-’06.

For simplicity, the easiest analogy to describe a normal reflation trade is a beach ball. When a recession occurs, the beach ball (the economy) deflates. But, low interest rates and government stimulus act as an air pump, and eventually the beach ball (economy) reflates.

Accelerating economic growth and rising inflation (due to easy money) are the “air” that inflates our economic beach ball. From a market standpoint, economic reflations are usually wonderful things. Markets go up in concert, and the way to outperform is to add beta and be exposed to cyclical, growth-oriented sectors. During a normal reflation (the last one was in ’03-’06) everything goes up regardless of what else is going on in the world.

However, this reflation is different.

Eight years after the end of the financial crisis, our economic beach ball is only half full. That’s because we’ve pumped in the “air” of accelerating economic growth (GDP going from negative to 2.5%ish) but we haven’t pumped any “air” of inflation in, yet.

Despite that, stocks are at all-time highs. Valuations are as stretched as any of us have seen them in decades. And, now we’re very late in the typical economic cycle.

Given that, barring some big surprise on tax cuts or infrastructure spending, it’s unlikely that we’re going to see a material acceleration of economic growth. In reality, 3.5% – 4% GDP growth is quasi impossible given demographics in this country—specifically the large demographic of baby boomers entering retirement, and them being replaced by a smaller workforce.

Getting back to our beach ball analogy, if inflation finally accelerates there will be a shorter time of euphoria—as the other half of our beach ball inflates. We got a hint of that in September.

But given valuations, stock prices and economic growth all are at or nearing reasonable ceilings, the risk is that after a short bit, the “air” from rising inflation over inflates our economic beach ball, and a bubble (or multiple bubbles) develop and we burst the ball. Practically, what I’m talking about is the Fed hiking rates and inverting the yield curve, which would be our signal that the beginning of the end of this eight-year expansion is now upon us.

From an advisor or investor standpoint, this creates a difficult set up. For now, we must continue to be invested and, potentially, allocate to the reflation sectors. Yet we also must do so knowing that unlike most revelations, we’re not going to enjoy an easy rally that lasts years.

So, the now years-long game of market musical chairs continues, albeit with a potentially reflation accelerating the pace of the music. For shorter or more tactical investors, holding “Reflation Basket” allocations makes sense as we approach and navigate these upcoming events.

For longer-term investors, we continue to await confirmation from the 10-year yield that this reflation truly is upon us. A few closes above the 2.40% level will be the signal, in our opinion, to rotate out of defensive names and into part or all of our Reflation Basket—Banks (KRE/KBE/EUFN), industrials (XLI), small caps (IWM) and inverse bond funds (TBT/TBF).

Bottom line, at this point in the economic cycle, for stocks to move materially higher we need inflation to accelerate and cause that reflation trade, but weneed to realize that brings us one step closer to the ultimate “bursting” of the recovery. This market remains more dangerous over the medium/longer term than the low VIX would imply.

Cut through the noise and understand what’s truly driving markets, as this new political and economic reality evolves. The Sevens Report is the daily market cheat sheet our subscribers use to keep up on markets, seize opportunities, avoid risks and get more assets. Sign up for your free two-week trial today and see the difference 7 minutes can make.