Posts

A More Hawkish-Than-Anticipated Federal Reserve: February 15, 2017

An excerpt from the Sevens Report. Sign up for a two-week free trial of the full report at www.7sReport.com.

Yesterday I began profiling a couple of non-political risks to explore when making decisions for your clients and talking with prospects. Here’s the second:

Non-Political Risk 2: A More Hawkish-Than-Anticipated Federal Reserve

Profiling this risk seemed only natural, given Yellen’s Humphrey-Hawkins testimony yesterday, and her marginally hawkish comments served as a good reminder that the market is pretty complacent with regards to expected Fed rate hikes in 2017.

Yellen’s comments to the Fed on Tuesday, February 14th, were slightly hawkish.

Starting with Yellen, she was slightly hawkish in her comments mainly because of her upbeat assessment of the economy combined with her reiteration that waiting too long to hike rates would be “unwise,” and that the Fed will consider further increases at “upcoming meetings.” Finally, Yellen repeated that she expects a “few” rate hikes this year (she cited the median dots were three hikes in 2017).

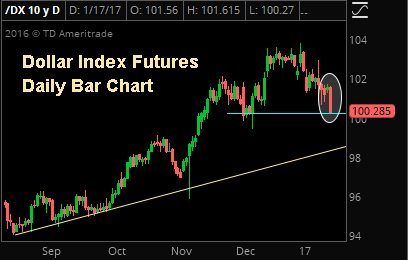
While none of those comments were new, it was a reiteration that the economy is doing relatively well and that the Fed is focused on removing accommodation, and markets reacted slightly hawkishly as the dollar rose while Treasuries declined/yields rose.

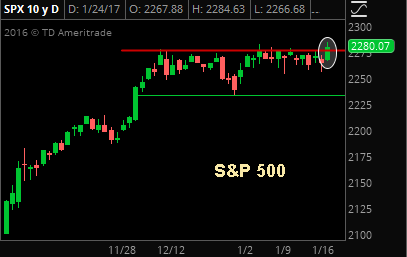
From an equity standpoint, the fact that the Fed has not been hawkish so far in 2017 has helped stocks rally, as the 10-year Treasury yield has backed away from the 2.60% level. Above that we believe higher rates will start to become a headwind on stocks. But, there is clearly a risk that rates rise higher than current expectations, and as such we want to profile that risk.

Probability of 3 rate hikes this year (one more than expected)? > 50%. This is my opinion, and it’s higher than the current consensus, but to me it makes sense. If investors think that better growth is going to support the stock market, then why do they expect that acceleration in growth not to invite more interest rate hikes from the Fed? The answer is because the Fed has been ultra dovish for years, but I believe that is changing due to multiple factors.

First, growth is as good as it’s been in years. Second, dis-inflation/deflation is no longer a threat (we think this is an underappreciated change in the macro-economic dynamic). Even in ’13 and ’14, when growth had periods of acceleration, inflation was still trending downward and the Fed was in full QE mode. Now, inflation is trending upwards. Third, the composition of the Fed will change as Trump can nominate three Fed members this year, and it’s a good bet they will be more on the hawkish side. So, while it’s still Yellen’s Fed, the scales should start to tilt toward the hawks later this year.

“Leading Indicators” and, “How do we position if it happens?” sections are restricted to subscribers.

Take advantage of the limited time special offer—if you subscribe to the Sevens Report today, and after the first two weeks you are not completely satisfied, we will refund your first quarterly payment, in full, no questions asked.

Copyright 2017, Kinsale Trading LLC. All Rights Reserved. www.sevensreport.com

Economic Growth Slows: February 14, 2017

An excerpt from today’s Sevens Report.

Non-Political Risk #1: Economic Growth Slows.

Stronger economic data remains an unsung hero of this post-election rally, and while Trump gets the headlines, it’s really the economic data that’s enabling this rally as better economic growth is allowing the market to continue to give Trump and the Republicans the benefit of the doubt.

I can go through the litany of reports, but whether it’s PMIs, the Jobs Report, or Business Investment, the data has been accelerating since mid to late 2016, and that’s created the proverbial “rising tide” that’s helped under-write both policy optimism and the rally in stocks.

But, while hope may be growing that there will be less drama from the administration (the reason for Monday’s rally), at the same time there’s growing evidence that actual policy reality will not meet market expectations.

So, in the near term, it’s going to be up to economic data to continue to provide a reason for markets to give Washington the benefit of the doubt, otherwise the sober reality of a market that now trades well over 18X current-year earnings will begin to cause problems.

Bottom line, if economic growth slows in the near term, that will cause a pullback in stocks. So, in today’s Sevens Report for subscribers, I go into detail on: 1) How likely is an economic slow down? 2) What are the leading indicators to watch? and, 3) How do we position if it happens?

First, how likely is an economic slow down? > 50%.

A probability that high may surprise people, but I have several reasons for it: First, we’ve seen an acceleration in economic activity, but we still haven’t really achieved the “breakout” pace of consistent 3% GDP growth that tends to feed on itself and further stimulate the economy. For all the excitement, we’re still in a 2%ish GDP regime (GDP Now from the Atlanta Fed has Q1 GDP at 2.7% in Q1). Point being, things down have to slow very much before the economy is right back in neutral.

Second, the consumer has powered this economic acceleration, but the consumer is tired. Credit creation is slowing, and retail sales reports have been lackluster of late. To boot, the job market remains basically at full employment and while wages are rising, they aren’t rising fast enough to power incremental acceleration consumer spending. Unless we see proof consumers are accessing the equity in their homes, I don’t see what will cause consumer spending to grind higher.

The Citi Economic Surprise Index rose steadily through Q4 of 2016 as economic data consistently beat expectations. Going forward, this index is now an important leading indicator for the market, as any material move back down towards zero will create a headwind on stocks.

Third, business investment has accelerated lately and that is good, but the uncertainty over the tax code changes (and trade in general) has the potential to be-come a headwind on business investment. Here’s my point: The tax changes being discussed in Congress could eliminate interest deductibility and change a host of other tax issues. If I’m a business and I’m thinking of getting a big loan to finance expansion, I’m likely going to wait until there’s more clarity on these and trade issues be-fore taking on too much risk.

Finally, leading indicator of growth for the global economy, China, is actively trying to slow its economy. China’s credit-fueled expansion back in February 2016 marked an inflection point in the global economy and things have been better since. But with a year of stimulus be-hind it, currency issues, and once again overheating property and asset markets, Chinese authorities are trying to cool their economy. The effects aren’t immediate or direct on the US economy, but the fact is that a slow-ing Chinese economy will become a headwind on the US at some point (how much of a headwind depends on how well the cooling is managed).

“Leading Indicators” and, “How do we position if it happens?” sections are restricted to subscribers.

Take advantage of the limited time special offer—if you subscribe to the Sevens Report today, and after the first two weeks you are not completely satisfied, we will refund your first quarterly payment, in full, no questions asked.

Copyright 2017, Kinsale Trading LLC. All Rights Reserved. www.sevensreport.com

The Oil Market: Then and Now

The Oil Market: Now and Then

We have included in today’s report a chart that was featured in a Forbes article yesterday regarding the two main influences on the oil market right now: rising US output and OPEC/NOPEC production cuts. At first look, the chart suggests that using hindsight as a gauge, US production lags the rise in rig counts which supports the argument that US production will not rise fast enough to offset the OPEC/NOPEC efforts. But we think that argument is flawed and here is why.

During the last aggressive expansionary phase for US oil production (rising US rig counts/increasing output) which lasted from 2009 to 2014, oil prices were wavering between about $80 and $110/bbl. The correlation between the pace of rig count growth and production growth was rather low as you can see by the difference between the slopes of the two lines in the chart. The likely and simple reason for that low correlation is the fact that there was a lot wild cat drilling, thanks to a surge in industry investment, that turned out to be unsuccessful.

In today’s lower price environment, efficiency is key and exploratory drilling, especially in unconventional areas, is at a minimum while producers focus their time, efforts, and investments on reliable sources of oil with considerably lower lift costs. If this is indeed the case as we believe it is and a good portion of the increasing rig counts that are being reported by BHI are actually DUCs (Drilled but Uncompleted wells) in proven areas, then the relationship between rig counts and production should have a tighter correlation than it did 5-10 years ago.

Bottom line, the fundamental backdrop of the energy market is different right now than it was between 2009 and 2014 and because investment in energy is much lower while the industry remains focused on efficiency, we are more likely to see a tighter correlation between rising rig counts and rising US production which would result in a faster pace of production growth. That in turn would offset the efforts of global producers who are trying to support prices and as a result, leave us in a “lower for longer” oil environment.


S&P Holds Key Support Level

The S&P 500 fell sharply to start the day yesterday, but a late day rally saw the index reclaim an important support level at 2280 by the Wall Street close.


Crude Oil Breakout

WTI crude oil futures broke out of a multi-week trading range yesterday and closed just shy of a new 2017 high as a sellers-strike continues ahead of data releases that could confirm (or discredit) proposed global output cuts.


Stock Market Update: January 26, 2017

Here is a “Stock Market Update” from The Sevens Report: Stocks finally moved Tuesday, as the S&P 500 staged a modest rally following good economic data and well received (but not really positive) political headlines. The S&P 500 rose 0.66%.

stock market updateStocks were flat to start Wednesday trade thanks to generally “ok” economic data from Europe (the European and German flash PMIs were light). There were also a lot of earnings reports, but they were the normal gives and takes, and none of the big companies reporting really moved markets beyond their specific sector (JNJ weighed on healthcare, but that’s it).

After the flat open, stocks started moving higher following a strong January flash manufacturing PMI, and the gains accelerated following several political headlines.

First, the Trump/auto company CEOs meeting was uneventful; then Democrats unveiled a $ 1 trillion infrastructure spending bill, and finally the president signed executive orders to reopen negotiations on the Keystone and Dakota Access pipelines. Stocks hit their highs early afternoon, and the S&P 500 made a new fractional all-time high before backing off just a bit into the close.

Stock Market Update: Trading Color

Yesterday was the first big Trump On day in markets since the first few days of 2017, as small caps and cyclicals handily outperformed.

The Russell 2000 rose 1.5%, more than doubling the S&P 500’s performance while cyclical sectors handily outperformed. Banks (KRE), financials (XLF), industrials (XLI) and basic materials (XLB) all rose more than 1%, with the

latter rising nearly 3% on a big DuPont (DD) earnings beat that pushed the Dow higher (they are heavily weighted in XLB, so the strength there was chemicals based, not commodity based).

Outside of DD earnings there weren’t really any big market movers, with the exception of JNJ weighing on the healthcare sector. XLV dropped 0.70% on the JNJ miss, although the weakness was somewhat isolated as the Healthcare Providers ETF (IHF) rose 0.29%.

Most of the remaining SPDRs we track were up about 0.60% (including consumer staples, which traded pretty well), although utilities were only fractionally higher on the rise in bond yields.

Bottom line, none of the political actions mentioned yesterday were surprises, but overall it was a generally business friendly day of headlines from Washington. That, combined with the PMIs, helped stocks rally.


S&P Chart: Strikes New All-Time High

S&P Chart: “A new high” is the oldest confirmation signal of a bull market in technical analysis and the S&P reached a new all-time high yesterday leaving the path of least resistance higher still from here.


WTI Futures: Technically, Oil Is Still Trending Higher

WTI Futures

WTI Futures: Oil has been trading sideways for two months as traders weigh rising US production against potential compliance failures among global producers who have committed to cut production. But, the technical outlook remains bullish.


The Next “Trump-Off” Gold Target

Gold futures have stalled at resistance just above the $1200 mark as money flows largely shifted back into “Trump-on” mode yesterday. But, if things go back to “Trump-off” the rally could extend to $1300/oz or higher.


Dollary Futures: “Trump-Off Trade” Leads Dollar to Test Key Support

dollar futures

The dollar index fell into a key support level yesterday as the market remained in “Trump-Off” mode. If support just above 100 is violated, dollar index futures could quickly fall back to the uptrend line pictured above, near 98.00

Donald Trump and British PM Teresa May were the two major influences on the currency markets yesterday, as Trump’s comments to the WSJ over the weekend about the dollar being too strong, combined with May’s Brexit address being slightly less hardline than feared, caused a big drop in the greenback. Meanwhile, the pound surged nearly 3% (it’s best day since ’08). The Dollar Index closed down 0.75%.

Starting with the biggest mover on the day, the pound hit fresh multi-decade lows over the weekend on fears of PM May taking a hard line in her Brexit address (the pound briefly broke through 1.20 late Sunday). But in her comments yesterday, May said that while she will seek a clean break from the EU, any final deal will be put to a vote before Parliament.

It was the last point that ignited the pound rally, because while the news of the vote isn’t exactly positive (it will still be a “hard Brexit”) it does introduce some sort of moderating force and influence into the negotiations. And, since it was unexpected, it caused one massive short-covering rally.

Going forward, do we think today’s news marks the low in the pound?

No, not unless US economy rolls over. That’s because Brexit will be a consistent headwind on the pound for quarters and years (May said she will begin a two-year negotiation with the EU in late March). Unless you are a nimble traders, we certainly would not want to be long the pound, as we don’t think this is the start of any material rally (again, absent any rollover in the US data).

Turning to the US, Trump’s comments about the dollar being too strong over the weekend and “killing” US manufacturing hit the currency. As a result of those comments, all other major currencies were universally stronger vs. the buck. The euro and yen rose 0.80% each while the Aussie rose 1% and the loonie rose 0.60%.  Nothing particularly positive occurred with those currencies, they were simply reacting to dollar weakness.

Going forward, at this point I don’t see Trump’s comments as necessarily dollar negative, and for one simple reason. If he accomplishes his goals of tax cuts, infrastructure spending and deregulation, the Fed will hike interest rates much more aggressively than is currency expected, as inflation will accelerate—and that will be demonstrably dollar positive despite what Trump says.

Near term, clearly the momentum is downward, and the dollar is testing support at 100.24. A close below that level likely opens up a run at, and through, par, with truly firm support resting in the high 90s.

Turning to Treasuries, they also traded Trump Off yesterday, in part due to the uncertainty of Trump’s comments (generally though, he didn’t say anything Treasury positive), and the 30 year rose 0.60% while the 10 year rose 0.35%. The 10 year hit a fractional two-month intraday high while yields on both bonds hovered near two-month lows.

Much like the dollar, we don’t see the recent Trump Off rally in bonds as longer-term violation of the new downtrend. Again, that’s based on the simple fact that if growth accelerates, so will inflation, and the Fed will have to hike rates faster than is expected—and that will power bond yields higher.

Near term, clearly we are seeing consolidation. If today’s CPI is light, and the Philly Fed is light later this week, and if Yellen is dovish in her comments, then we could see the 10-year yield test 2.30%. Longer term, unless we see a big reversal in economic growth, this counter-trend rally in bonds remains an opportunity to get more defensive via shorter duration bonds, inflation-linked bonds (VTIP) or inverse bond ETFs.