Posts

Last Week and This Week in Economics, March 27, 2017


“Last Week and This Week in Economics”—an excerpt from today’s Sevens Report: everything you need to know about the markets in your inbox by 7am, in 7 minutes or less.

For all of 2017, better-than-expected economic data has helped to offset the decreased likelihood of pro-growth policies from Washington, and that continued last week as what little economic data we did receive was generally supportive for stocks.

The Sevens Report, March 27, 2017Looking at Durable Goods, longer-term readers know we ignore the headline and look straight for New Orders for Non-Defense Capital Goods ex-Aircraft (NDCGXA). That is the better measure of business spending, as the headline Durable Goods order is massively skewed by the timing of aircraft orders.

NDCGXA missed estimates in the Feb. report (-0.1% vs. (E) 0.5%), but the January data was revised higher (from -0.4% to 0.1%). So, that largely offsets the miss in February.

The March flash manufacturing PMI was a disappointment, as it missed estimates and hit a surprise six-month low at 53.2 vs. (E) 54.3. But while disappointing, the flash PMI forecasted weakness in February that didn’t appear in other national manufacturing PMIs, and even at 53.2, that’s still a decent absolute number (remember, anything above 50 shows activity accelerating). Point being, that one number doesn’t suggest a loss of momentum.

Looking at other data, February Existing Home Sales slightly missed estimates but February New Home Sales beat estimates. But, with housing it’s helpful to step back from the monthly data and observe the overarching trend, and that trend is stability. All the housing data confirms that so far. Higher mortgage rates are now causing a noticeable slowdown in the housing recovery, and that remains key un-sung support for the economy.

Turning to the Fed, there were multiple speakers last week, but the headliner was Fed Chair Yellen, who made no comments about the economy or policy during her speech. Other Fed members were on balance slightly hawkish, as many of them referenced hiking three or four times this year, but none of it was impactful enough to reverse the dollar or Treasury yield decline we’ve seen since the Fed’s dovish hike in March. Markets still have a June rate hike at about a 50/50 proposition, unchanged from last week.

Bottom line, all the focus was on politics last week, but economic data remains the unsung hero of 2017, and it continues to help offset growing policy headwinds via Washington.

This Week

This week will be another relatively quiet week from an economic standpoint, and once again the most important number won’t come until Friday.

That number is the Core PCE Price Index contained in the Personal Income and Outlays report. That’s important because it’s the Fed’s preferred measure of inflation, and if the headline PCE Price Index breaks through 2.0% yoy (last 1.9%), and the Core PCE Price Index moves further towards 2.0% (last 1.7%), that may elicit a slightly hawkish reaction in markets.

Internationally, there are two notable reports to watch. First, Chinese Manufacturing PMI hits Thursday night, and while China remains on the back burner from a macro standpoint, any signs of economic slowing will surprise markets. Second, EMU Flash HICP (their CPI) comes Friday. The best outcome for European stocks is a Goldilocks number, where core inflation doesn’t rise much from the current 0.9% yoy pace, and as such doesn’t make the ECB think about ending QE prematurely. A Goldilocks number will be positive for European ETFs (HEDJ, VGK, EZU).

Bottom line, this will be another quiet week from a data standpoint, but the numbers need to confirm the acceleration of growth to continue to support stocks. From a risk standpoint, too-strong HICP or Core PCE numbers are the events to watch (they might make the Fed and ECB lean more hawkish).

Politically, there will be a lot of analysis on the shift towards tax cuts (we’ll do a primer this week), but nothing truly important is scheduled. Finally, on the international front, British PM May will formally trigger Article 50 to begin the Brexit process (although that shouldn’t cause much volatility).

Help your clients outperform markets with the Sevens Report. Claim your free trial today: 7sReport.com.

The Case for Europe, March 21, 2017

Sevens Report - The Case for EuropeThe Case for Europe, an excerpt from today’s full Sevens Report. Join hundreds of advisors from huge brokerage firms like Morgan Stanley, Merrill Lynch, Wells Fargo Advisors, Raymond James and more… see if The Sevens Report is right for you with a free trial.

For the past several weeks, I’ve been consistently mentioning Europe as an attractive tactical investment idea. Today, I wanted to more fully lay out the investment thesis, one that is based on 1) Compelling relative valuation, 2) Continued central bank support (i.e. QE), and 3) Overestimation of political risks.

I believe those three factors have created an attractive medium-term risk/reward opportunity in European stocks, and I believe the region can outperform the US over the coming months, especially if we see policy disappointment from Washington.

Bullish Factor #1: Compelling Relative Valuation.

The reasoning here is simple. The S&P 500 is trading at the top end of historical valuations: 18.25X 2017 EPS, and 17.75X 2018 EPS. There’s not much room for those multiples to go higher, and if we get policy disappointment or the economic data loses momentum, markets could hit a nasty air pocket.

Conversely, the MSCI Europe Index is trading at 15.1X 2017 earnings, and 13.8X 2018 earnings. That’s a 17% and 22% discount to the US. So while it’s true Europe should trade at a lower multiple vs. the US given the still-slow growth and political issues, those discounts are pretty compelling. In a world where most equity indices and sectors are fully valued, Europe offers value.

Bullish Factor #2: Ongoing Central Bank Support.

This one also is pretty simple… the ECB is still doing QE. The ECB is still planning to buy 60 billion euros worth of bonds through December of this year. That will support the economy, help earnings and push inflation higher, all of which are positive for stocks. Now, there is a risk that the ECB could begin to taper its QE program before December, or end it all together in December, but neither risk looms immediately, and the much more likely result is that the ECB tapers QE starting in 2018 and ends the program in June 2018. In that scenario, the outlook for Europe over the coming months remains positive.

Bullish Factor #3: Overblown political risk.

We’ve been talking about this for a while, but the fact is that political risks in Europe are overblown, and just like people underappreciated risks in 2016, I believe they are now overreacting to Brexit and Trump by extrapolating those results too far.

Going forward, there are really two important elections this year: France and Germany. The worry is that far-right candidate Marine Le Pen will win the presidency, but that remains extremely unlikely. The top end of her support looks to be just 25%, which might be enough to win the first round of voting (where voters will cast ballots for no less than 11 candidates). Yet according to all the polling, she badly loses the second round of voting by margins as big as 30% to 70%. Point being, Le Pen is not Brexit, and she’s not Trump.

Second, Germany will have elections in September, and Social Democrat leader Martin Schulz will challenge Merkel for the Prime Minster position. Schultz is a former President of the European Parliament, and he’s not anti EU at all. So, if he wins, from an EU outlook standpoint, it isn’t a negative. Now, I’m not going to get into the details of his politics, because they aren’t yet important for this investment. The bigger point is that it’s not really a problem for the European economy if Schultz wins. Bottom line, we’ve done well in international investments in the past (Japan during Abenomics, Europe when they started QE), and we believe this is another opportunity to outperform.

How to Play It: VGK vs. EZU vs. HEDJ. For subscribers only.

This is a volatile, politically sensitive investment landscape, here in the US and in global markets, the Sevens Report can help you stay ahead of the changes, and know the right thing to say to calm concerned clients. Sign up to get your free two-week trial today.

What to Expect in Tomorrow’s Jobs Report. March 9, 2017

Jobs Report Preview: For notable releases like tomorrow’s jobs report, the Sevens Report offers a “Goldilocks” outlook to give a few different scenarios: too hot, too cold, and just right.

This gives our subscribers clear talking points to explain the importance of the report to clients and prospects clearly and without a lot of jargon. As always, the Sevens Report is designed to help you cut through the noise and understand what’s truly driving markets—all in seven minutes or less and in your inbox by 7am each morning. Sign up for your free 2-week trial today and see the difference this report can make for you.

Wednesday’s ADP Jobs Report clearly put upward pressure on expectations for tomorrow’s government report. And, there’s good reason for that. Over the past five months, the ADP report has been within 10k jobs of the official jobs report (the one outlier was November, when ADP was 50k over the actual jobs report). So, yesterday’s 298k jobs blowout implies a big number tomorrow.

Given that, the major issue for tomorrow’s jobs report is simple: Will it cause the Fed to consider more than three rate hikes in 2017? If the answer is “yes,” than that’s a headwind on stocks. If the answer is “no,” then it shouldn’t derail the rally.

Getting a bit more specific, the only reason the dollar is still generally stuck at resistance at 102 (and below the recent high at 103), and the 10-year yield is still below 2.60% is because the market assumes that the Fed will still only hike rates three times this year.

If that assumption gets called into doubt via a very strong jobs and wage number tomorrow, we will see the Dollar Index likely surge through 103 and the 10-year yield bust to new highs above 2.60%, and then they will begin to exert at least some headwind on stocks.

So, tomorrow’s jobs report is potentially the most important jobs number in years, as it has the ability to fundamentally alter the market’s perception of just how “gradual” the Fed will be in hiking rates.

“Too Hot” Scenario (Potential for More than Three Rate Hikes in 2017)

  • >250k Job Adds, < 4.9% Unemployment, > 2.9% YOY wage increase. A number this hot would likely ignite the debate about whether the Fed will hike more than three times this year (or more than 75 basis points if the Fed hikes 50 in one meeting). Likely Market Reaction: Restricted for subscribers: Access today by signing up for your free 2-week trial.

“Just Right” Scenario (A March Rate Hike Is A Guarantee, But Three Hikes for 2017 Remain the Expectation)

  • 125k–250k Job Adds, > 5.0% Unemployment Rate, 2.5%-2.8% YOY wage increase. This is the best-case scenario for stocks, as it would imply still-stable job growth, but not materially increase the chances for more than three rate hikes in 2017. This is the most positive outcome for stocks. Likely Market Reaction: Restricted for subscribers: Access today by signing up for your free 2-week trial.

“Too Cold” Scenario (A March Hike Becomes in Doubt)

  • < 125k Job Adds. This would be dovish, and while the fallout would be less than previous months given the market’s focus on future growth, the bottom line is bad economic data still isn’t good for stocks. Dovish isn’t bullish any-more. Likely Market Reaction: Restricted for subscribers: Access today by signing up for your free 2-week trial.

Join hundreds of advisors from huge brokerage firms like Morgan Stanley, Merrill Lynch, Wells Fargo Advisors, Raymond James and more… see if the Sevens Report is right for you.

How Does Trump’s Approval Rating Impact The Stock Market? March 8, 2017

Leading Indicator Update: Showing Signs of Fatigue

An excerpt from today’s Sevens Report… Skip the jargon, arcane details and drab statistics, and get the simple analysis that will improve your performance.

At the start of the year, I said that beyond the normal economic data and fund flow data, we’ll be watching two other specific leading indicators:

  • Trump’s approval rating, and the
  • Semiconductor Index.

As a refresher, we watch Trump’s approval rating because it is an imperfect, but still effective, measure of political capital.

Earlier this year, we said that if his approval rating dips in the weeks and months following Inauguration Day, that won’t be a positive sign for corporate tax cuts (i.e. it will be stock negative). Conversely, if his approval ratings rise following his inauguration, the chances of tax reform will rise (i.e. it will be stock positive).

Turning to the Semiconductor Index (see chart on Pg. 1), we view semiconductors as a destination for incremental capital that comes off the sidelines or out of bonds.

It’s our proxy for money flows, or “chasing” into the US markets.

That reasoning here is based on watching the price action in semis and observing that they handily outperformed post election (implying they were a destination for capital coming off the sidelines), and we continue to believe that is the case.

LI #1: Trump’s Approval Rating Updated. The outlook here hasn’t been that positive, and the movement in the approval rating anecdotally confirms our opinion that the market remains too optimistic regarding corporate tax cuts in 2017.

Why is the president’s approval rating a leading indicator?

From a broad standpoint, Trump’s approve/disapprove gap has gotten worse since the inauguration, and we think that represents a slight erosion of political capital.

Last week, we saw a slight bounce following his speech to Congress, but the numbers look to be rolling over again.

I am particularly focused on his raw approval rating numbers (as opposed to just the spread between approve/disapprove). So, while the spread between approve/disapprove has gotten worse, the reason this leading indicator isn’t flashing negative for me is because Trump’s raw approval rating is still about the same as it’s been since the inauguration (about 44%).

However, if that raw number were to drop below 40%, I would view that as a material negative for pro-growth policies… and a potential negative for stocks.

LI #2: Semiconductor Index Updated. The Philadelphia Semiconductor Index, our loose proxy for incremental money flows out of bonds/other assets and into stocks, has until recently confirmed the 2017 rally.

The SOX rallied 9% from the first of the year till February 22, at which point the index stalled, and it’s traded side-way for nearly two weeks.

Going forward, support at 955.11 now is an important level to watch, as a break of that level would constitute a “lower low” on the charts.

Below that, support at the 20-day moving average at 947.25 has supported this index three times over the past few months. So, that also will be an important level to watch.

Bottom Line

Neither of these leading indicators have sent a non-confirmation signal of the rally at this point. Yet after confirming the rally earlier this year, both of these leading indicators are starting to wobble.

Again, we’ll be watching 40 in Trump’s approval rating and 955 and 947 in the SOX. If those levels are broken that will likely prompt us to become more defensive near term for stocks.

Join hundreds of advisors from huge brokerage firms like Morgan Stanley, Merrill Lynch, Wells Fargo Advisors, Raymond James and more… see if The Sevens Report is right for you.

Disappointing Numbers from Flash February Manufacturing & Service PMIs: February 22, 2017

Below is an excerpt from the “Economics” section of the Sevens Report. The Sevens Report has everything you need to know about the markets by 7am each morning in 7 minutes or less—can get a free trial if you sign up now.

Flash February Manufacturing & Service PMIs

  • Feb. Manufacturing PMI declined to 54.3 vs. (E) 55.5.
  • Fed. Service PMI declined to 53.9 vs. (E) 55.9.

Takeaway

In what was a surprising contradiction to last week’s very strong Empire and Philly manufacturing PMIs, both flash PMIs declined, and implied increased stagflation risk, signaling that further economic acceleration is not a foregone conclusion.

Now, to be clear, neither number was outright bad in an absolute sense. Both numbers in aggregate are reflective of a decently strong economy. Yet in order to power stocks higher in the context of growing political dysfunction, data needs to continue to show acceleration, and neither of these flash PMIs showed acceleration.

Declines in Nearly Every Sub Index of the PMI

Looking specifically at the manufacturing PMI, New Orders, the leading indicator in the Report, dipped to 56.2 from 57.4 (still a very high absolute reading but a decline nonetheless). In fact, virtually every sub index declined in February except for input prices, which rose slightly to 56.1 from 56.0. Notably, output prices (i.e. selling prices) dipped slightly to 51.7 vs. 51.9, which is indicative of margin compression. One number doesn’t make a trend, but that’s something to keep an eye on.

Bottom line, the flash PMIs are one of the bigger economic numbers each month, and this was a surprising disappointment. It won’t change the trajectory of the rally near term, but strong (and stronger) economic data is a critical support to this market, especially in the face of growing doubts in Washington. So, the rest of February’s data just got a lot more interesting.

Get the simple talking points you need to impress clients and prospects. Sign up for your free trial today: The Sevens Report.

What impact are Trump’s headlines having on markets?

Trump makes a lot of headlines, but what actually impacts the market?

After impacting the markets with his comment about a forthcoming “phenomenal” tax plan, the markets have been surprisingly unmoved by any of the headlines coming in from Washington D.C.

This week, we’ve seen stocks focusing on the good economic data (retail sales, Empire Manufacturing) and ignoring the political drama (Trump’s Labor Secretary nominee, Andrew Puzder, withdrew yesterday). Earlier this week, the market also remained steady after the news of National Security Administration Michael Flynn’s resignation.

What might Trump do to impact the market? After campaigning with somewhat hostile trade rhetoric, we’ve the realities of global trade soften his tone a bit. For example, he embraced the “One China” policy of governance over Taiwan. Similarly, so far Trump has resisted instructing the Treasury Department to label China a “currency manipulator” in its semi-annual currency report, due out in late March/early April. That would obviously be bad for stocks.

Find out first and keep your clients and prospects in the know. Sign up for your free trial of the Sevens Report and you’ll get all the market analysis in your inbox by 7am each morning. www.7sReport.com


How Big a Risk is a Trade or Military Dispute? February 16, 2017

An excerpt from the Sevens Report. Sign up for a two-week free trial of the full report at www.7sReport.com.

Earlier this week I began profiling non-political risks to explore when making decisions for your clients and talking with prospects. Here’s number three:

Non-Political Risk #3: Surprise Trade or Military Dispute

Surprisingly, and potentially dangerously, the market has fully embraced Trump’s pro-growth “big three” of tax cuts, infrastructure spending, and deregulation while totally ignoring the hostile trade (and to a lesser degree) military rhetoric—and that selective focus has helped fuel this rally in stocks.

How big a risk is a trade conflict with China?

Part of the reason investors have somewhat ignored the rhetoric is because they assumed that once Trump got into power, the realities of global trade would soften his tone. To a point, that has happened. Last week, Trump embraced the “One China” policy of governance over Taiwan. And, this past weekend visit with Japanese PM Abe came and went with no explicit mention of currency manipulation or unfair trade. But, while those are positives it’d be foolish to think there isn’t a real risk of a trade dispute/war with China.

Originally, the fear was that Trump would instruct the Treasury Department to label China a “currency manipulator” in its semi-annual currency report, due out in late March/early April. That would likely ignite some sort of a trade war as it would place automatic tariffs on Chinese goods. Obviously, that wouldn’t be good for stocks.

Trump appears to have backed away from such a direct confrontation, but as a WSJ article detailed, the administration is looking for a less “in your face” way to punish China for its trade practices (you can read the article if you’re really interested) but basically the strategy is to label currency manipulation an “unfair subsidy,” not just by the Chinese, but by every country. If that’s done, then individual US companies can lobby the Commerce Department to impose du-ties on competitive goods from countries they believe use currency manipulation. It’s basically a less-direct way to put duties/tariffs on Chinese goods.

Here’s the problem: Other countries can retaliate and do the same thing to the US, and cite the Fed’s ultra-low rates as manipulating the US dollar lower.

This will obviously be a fluid situation, but with Peter Navarro as the head of the National Trade Council (remember he wrote the book, Death by China) it’s un-likely that we won’t at least have a trade scare this year with China.

Looking militarily, the only real area of concern right now (well, there are multiple areas of concern, but the most pressing one) is the growing conflict between the US and China regarding their bases in the South China Sea. Trump advisor Bannon is particularly focused on this issue, and military officials have flat-out said that China won’t be allowed to operate a functioning naval or air base on these manufactured islands. Again, this is a low-probability event, but it remains a possibility.

Probability of a disruptive trade war? <30%. While the possibility is there, I’d expect marginal moves to try and correct trade imbalances with China, not all out tariffs or import duties (although I’m sure they will be publicly threatened, which will be negative for sentiment).

“Leading Indicators” and, “How do we position if it happens?” sections are restricted to subscribers.

Take advantage of the limited time special offer—if you subscribe to the Sevens Report today, and after the first two weeks you are not completely satisfied, we will refund your first quarterly payment, in full, no questions asked.

Copyright 2017, Kinsale Trading LLC. All Rights Reserved. www.sevensreport.com

ECB Preview

The first of the major central bank decisions in September comes tomorrow via the ECB, and from a general standpoint the major question heading into this meeting is:

“Will the ECB ease further, hint at easing further, or stay firmly on the sidelines?”

Given the uncertainty surrounding tomorrow’s decision, I found myself in my home office last night writing our ECB Preview (sent to paid subscribers at 7 a.m. this morning) which explained:

1) What will make the meeting “hawkish” or “dovish” and

2) Provided the anticipated market reaction of stocks, bonds, the dollar, oil and gold for the three possible outcomes: The ECB meets expectations, the ECB is Dovish, or the ECB is Hawkish.

While I was working, my wife came in and asked me what I was doing and I told her, “Writing an ECB Preview,” and she asked, “What does the ECB have to do with stocks?”

In a few quick sentences I explained that the ECB was important because if it doesn’t hint at future easing, that will make German Bund yields go up, which will make Treasury yields go up, and that will make both stocks and bonds go down!

She smiled and told me, “I Can See Why People Subscribe!”

If you’re like me, never in your wildest dreams did you think when you started in this business that you’d have to be focused on what the ECB was doing because it could turn the US stock market.

In fact, I’m not even sure the ECB existed when I started in this business!

But, a Dot-Com bubble burst, financial crisis, QE Infinity and Negative Interest Rates later, here we are, and the simple truth is that if the ECB doesn’t do one specific thing tomorrow at their meeting and press conference, it will disappoint markets—and stocks will drop (more on that later).

We have spent the last few weeks making sure our paid subscribers know the list of six key events facing markets, because those events will cause at least short-term volatility, and knowing these events are looming helps advisors who subscribe to the full, paid edition of The Sevens Report
set the right expectation for clients… so that they aren’t blindsided if any of these events cause a market pullback.

And, if the ECB, BOJ or Fed disappoints markets and causes a spike in bond yields and pullback in stocks, our subscribers will be able to demonstrate to their clients they expected the volatility
and had a plan in place should things get worse.

That’s how advisors (both active and passive managers) use The Sevens Report
to improve client relationships and impress prospects.

Tomorrow’s ECB meeting does have the potential to cause a drop in stocks, so we want to make sure everyone knows

1) What’s Expected,

2) What Will Make the ECB Dovish and

3) What Will Make the ECB Hawkish.

We’ve included an excerpt of that research for you below as a courtesy:

ECB Preview (Sevens Report Excerpt)

To keep things in plain English, the ECB is important to advisors and their clients because the decision will move both the US bond and stock markets.

If the outcome of the ECB meeting is considered “dovish” that will be positive for US stocks
because that ECB decision will pressure German Bund yields lower, and that in turn will drag US yields lower and increase the case for justifying a further multiple expansion in stocks above 2200.

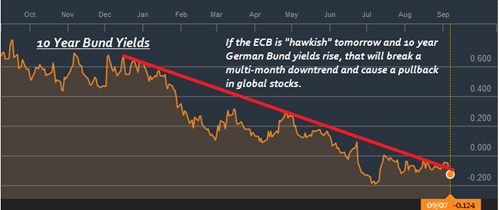
Conversely, if the ECB is taken as “hawkish” that will cause German 10-year Bund yields to likely turn positive, which will push US Treasury yields higher and weigh on US and European stocks. Below we have a guide to what’s expected, what would be considered dovish, and what would be hawkish.

What’s Expected: The ECB Hints at an Extension of QE.
The current ECB QE program ends in March, and most economists expect that Draghi will strongly hint that the current QE program will be extended for a second time, likely till the end of 2017. Likely Market Reaction: Restricted for Paid-Subscribers.

It will Be Hawkish If: There is no hint at a QE extension in December. If the ECB remains in a “Wait and See” mode given the more resilient EMU economy post Brexit, that will disappoint markets. Likely Market Reaction: Restricted for Paid-Subscribers.

It Will Be Dovish If: The ECB announces the extension of QE tomorrow, or hints at both the extension of QE and upcoming changes to the QE program.
To that latter point, one of the current issues with ECB QE is that there is a relative scarcity of bonds to buy in the market, so if the ECB is planning on materially extending QE it could also change the rules regarding what bonds it can buy (likely increasing the pool of corporate and sovereign debt). Likely Market Reaction: Restricted for Paid-Subscribers.

The key takeaway here is that uncertainty surrounding global interest rates is a becoming a more substantial headwind on stocks, and that’s why stocks were down again this morning, as the Bank of England Governor Marc Carney implied the Bank of England may not need to do as much stimulus as expected, post Brexit.

Bottom line, before stocks can move higher, there has to be clarity on the direction of interest rates, and that will only come from the ECB, Fed and BOJ.

If you do not have a morning report that is going to give you the plain English, practical analysis that will help you navigate those central bank events, then please consider a quarterly subscription to
The Sevens Report.
 

There is no penalty to cancel, no long term commitment, and it costs less per month than one client lunch!

With thousands of advisor subscribers from virtually every firm on Wall Street and a 90% initial retention rate, we are very confident we offer the best value in the private research market. 

I am continuing to extend a special offer to new subscribers of our full, daily report that we call our “2-week grace period.”

If you subscribe to The Sevens Report today, and after the first two weeks you are not completely satisfied, we will refund your first quarterly payment, in full, no questions asked.

Click this link to begin your quarterly subscription today.


Volatility Will be an Opportunity for the Informed Advisor and Investor in the 4th Quarter

We aren’t market bears, but we said consistently that things were going to be volatile in 2016, and we were right!

The market is not going to stay as quiet as it was this summer.


How could it, considering the events that are coming over the next few weeks:

  • The ECB Meeting September 8th: Will the ECB hint at more stimulus (bullish) or not (bearish)?
  • The Fed Meeting September 21st: Will the Fed hike rates (very bearish), hint at hiking rates in December (bearish) or stay ultra-dovish (bullish)?
  • The Bank of Japan Meeting September 21st: Will the BOJ adopt “Helicopter Money Light” (bullish), or just do another inconsequential easing like in July (bearish).
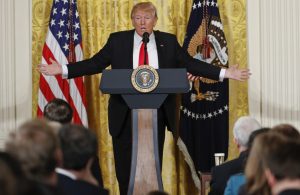
  • First Presidential Debate September 26th: Will Trump get back into the race (bearish short term – and this is not a political opinion) or will Clinton maintain a comfortable lead (not bearish).
  • International Energy Forum September 26th: Will OPEC and Non-OPEC members agree on a global production “freeze” (bullish oil) or not (very bearish oil).

Some advisors and investors will be blindsided by the volatility
these events might create, but the advisor who is able to confidently and directly tell their nervous clients what’s happening with the markets and why stocks are up or down, and what the outlook is beyond the near term (without having to call them back), will be able to retain more clients and close more prospects.

We view volatility as a prime opportunity to help our paying subscribers grow their books of business and outperform markets
by making sure that every trading day they know:

1) What’s driving markets

2) What it means for all asset classes, and


3) What to do with client portfolios.

We monitor just about every market on the globe, break down complex topics, tell you what you need to know, and give you ETFs and single stocks that can both outperform the market and protect client portfolios.

All for $65/month with no long term commitment.

I’m not pointing this out because I’m implying we get everything right.

But we have gotten the market right so far in 2016, and it has helped our subscribers outperform their competition and strengthen their relationships with their clients – because we all know the recent volatility has resulted in some nervous client calls.

Our subscribers were able to confidently tell their clients 1) Why the market was selling off, 2) That they had a plan to hedge if things got materially worse and 3) That they were on top of the situation.

That’s our job, each and every trading day. And, we are good at it. We watch all asset classes to generate clues and insight into the near-term direction of the markets, but our most important job is to remain vigilant to the next decline.

While we spend a lot of time trying to identify what’s really driving markets so our clients can be properly positioned, we also spend a lot of time identifying tactical, macro-based, fundamental opportunities that can help our clients outperform.

If you want research that comes with no long-term commitment, yet provides independent, value added, plain English analysis of complex macro topics, click the button below to begin your subscription today.
 

Finally, everything in business is a trade-off between capital and returns.

So, if you commit to an annual subscription, you get one month free, a savings of $65. To sign up for an annual subscription simply click here.
 

Best,
Tom

Tom Essaye
Editor, The Sevens Report
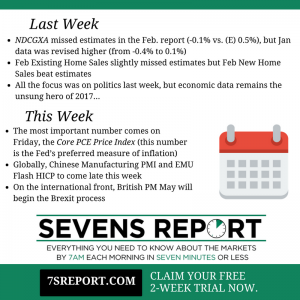


Boring But Important: Italian Banks

Since the Brexit vote we’ve been focused on watching European banks, as they will tell us when potential anti-EU political contagion morphs into actual financial contagion (which would be a bearish game changer). And while far from an “all clear,” there have been a few positives for European banks last week.

First, the SX7P, the STOXX Bank Index, has held that 117.53 low last Thursday, which is a general positive. Second, as mentioned, there was a quietly important article from the WSJ that detailed how the European Commibankitallyssion is allowing the Italian government to support any troubled Italian banks, if help is needed.

Generally speaking, in the short term at least, that is a positive as Italian banks are generally considered some of the weakest in all of Europe, with badly performing loans, terrible margins and weak balance sheets. So, this authority helped reduce the chances of an immediate issue.

However, at the same time, I do find it disconcerting this had to be done. First, it’s a bit of a validation of fears about how weak Italian banks have become. Second, Spanish and Portuguese banks are not much better than Italian banks (from a strength standpoint) so in some ways this raises concerns about them as well. Finally, unlike in the US, a European country being able to guarantee banks is not always a panacea.

Remember, the Irish government was bankrupted (basically) because they guaranteed bad Irish banks, whose liabilities exceeded the government’s assets! That’s why Ireland needed a bailout.

I’m not saying the same thing will happen in Italy, and we’re a long way from that point, but when governments who can’t print their own money start guaranteeing banks, I’m afraid I get a touch nervous.

So, bottom line, we saw a short-term step forward, but it doesn’t make me any less nervous about European banks more generally.

Bottom line, sentiment is better and that’s positive, but European banks remain “Ground Zero” for any signs of contagion from Brexit, and we’ll continue to watch SX7P closely.

Brexit Vote (What happened and What to do)

brexit-shutterstock2

Around 7 p.m. last night those of us watching markets knew we had a problem.  The results from Sunderland came in massively for “Leave,” and they were expected to only show a marginal “Leave” victory.  Immediately the pound dropped 4% on the news and global markets moved sharply lower.  It was the first clue there was going to be a surprise.

By midnight it was official:  The markets, betting odds and private pollsters were all wrong.  “Leave” was declared the winner, and at 1 a.m. last night the British Pound was down 10% vs. the dollar (at a 35 year low) and S&P 500 futures were down 100 points.  So, as shocking as it may seem, things have actually gotten a touch better since then.

From an analysis standpoint I want to focus on immediate takeaways and trying to answer questions you may have (or questions you may get from your clients regarding this event):

The Markets are Clearly Down Big But It’s Actually Not that Bad.  First, US stocks and the Pound are off the overnight lows, and European markets actually haven’t violated last week lows.  The S&P 500 did break down through 1940 but 1900 is acting as decent support this morning.  Bottom line, the numbers are messy but it could be worse.

Europe is now toxic from an investment standpoint:  First, I will be selling half my  HEDJ this morning and waiting to sell other half solely because I hate selling all of a position into a panic.  But, it’s understandable if anyone wants to unload it all into this decline.

For Great Britain, a messy 2 year “divorce” will begin from the EU and a massive cloud of uncertainty will descend on that economy.

Whether the Brexit will be good or bad for Britain or the EU economy remains unclear (and will stay that way for years). But, the bottom line is that businesses and people will become substantially more risk averse amidst all this uncertainty, and that sapping of risk taking and capital expenditure (which is the key to economic acceleration) will be a headwind on economic growth in the region.

Finally, get ready for more “Exits.”  Scotland actually voted to “Remain” in the EU last night, so there will almost certainly be another Scottish referendum, and it’s very possible last night’s outcome will result in the dissolution of Great Britain over the coming years.  For Europe, talk will start on a new kind of “Grexit.”  Only this time it will be a “German Exit.”  I’m not saying it’s likely, but last night’s decision will embolden all the nationalist parties across Europe, and the EU as a whole will now be under attack at the polls over the coming year.

MW-EQ064_sadin0_20160624011734_ORThis Is Not a Bearish Game Changer for the US Yet, But is A New, Material Headwind and Makes Us Cautious but Not Outright Bearish.  I am not wholesale reducing US equity exposure on this news because the direction of US stocks is more tied to the economy and valuation than Europe right over the medium and longer term.

But, there will be real world impacts for the US:  Earnings for the commodity producers, banks and multi-national exporters will all get hit and that further calls into question the $130 2017 EPS figure (which creates a valuation problem).  Economically, obviously the recent uptick in manufacturing activity is at risk, and the broad uncertainty isn’t helpful given we need to see further economic acceleration to power stocks higher.

Market Winners and Losers:  As mentioned in our preview yesterday, losers are exporters, banks/financials and commodity sensitive companies.  “Winners” are Treasuries (which will continue to surge as they and Japanse Government Bonds are now the safe have destination of choice), and domestically focused US stocks sectors.  If I were to buy anything today, it would probably be US investment grade corporate bonds (if we see a dip) because US balance sheets remain incredibly well capitalized.  LQD is one of the easiest ways to do this.

Do I Buy the Dip in US Stocks?  I don’t think so, at least not here.  Stocks aren’t cheap enough to buy the dip given the uncertainty.  At current levels the S&P 500 is trading just under 16X $120 EPS, and that’s not cheap enough for me.  I would look to potentially add some light longs between 1800-1850 so more towards 15X $120 EPS, with 1725 still representing compelling valuation (that’s 15X a $115 S&P 500 EPS).

What Makes This a Bearish Game Changer?  You will hear the term “Lehman Moment” a lot over the coming days but that’s a bit aggressive (at least so far).  As always, contagion is the risk here and the first signs of that will appear in British and European banks, so we will be watching the price action in the SX7P.  It that continues in free fall well into next week, that’s a major  warning sign.

Wildcard to Watch: The Yuan.  If the dollar continues to surge then we will have to worry about Chinese officials devaluing the yuan in retaliation.  That is one wild card to watch over the coming weeks if we see the dollar move higher towards par.

Bottom Line

This is not a bearish game changer for US stocks yet, but clearly the surging dollar and massaive uncertainty will be a renewed headwind.  We obviously remain cautious on stocks here but would not wholesale dump equities at this point.  Despite the hysteria, the outlook for stocks over the next year really hasn’t changed that much, as US economic growth remains the determining factor in whether stocks move materially higher from current levels.