What impact are Trump’s headlines having on markets?

Trump makes a lot of headlines, but what actually impacts the market?

After impacting the markets with his comment about a forthcoming “phenomenal” tax plan, the markets have been surprisingly unmoved by any of the headlines coming in from Washington D.C.

This week, we’ve seen stocks focusing on the good economic data (retail sales, Empire Manufacturing) and ignoring the political drama (Trump’s Labor Secretary nominee, Andrew Puzder, withdrew yesterday). Earlier this week, the market also remained steady after the news of National Security Administration Michael Flynn’s resignation.

What might Trump do to impact the market? After campaigning with somewhat hostile trade rhetoric, we’ve the realities of global trade soften his tone a bit. For example, he embraced the “One China” policy of governance over Taiwan. Similarly, so far Trump has resisted instructing the Treasury Department to label China a “currency manipulator” in its semi-annual currency report, due out in late March/early April. That would obviously be bad for stocks.

Find out first and keep your clients and prospects in the know. Sign up for your free trial of the Sevens Report and you’ll get all the market analysis in your inbox by 7am each morning. www.7sReport.com


Did One Fund Cause The Rally?

Make sense of the rumors FAST. Below is an excerpt from today’s Sevens Report: www.7sReport.com.

Easily the biggest story that circulated trading desks Thursday morning was an article that a $4 billion options fund was blowing up. In doing so, the implication was that is what has caused the relentless really we’ve seen in stocks since last Thursday.

The fund in question is the Catalyst Hedged Futures Strategy, and in a broad sense this fund sells volatility using option strategies.

Did one fund cause this rally?

The story/rumor going around is that this fund sold a massive amount of call spreads, making them effectively short $17 billion worth of S&P 500 Index futures. Well, you can imagine how that’s worked out over the past week, and the takeaway is that this fund has been relentless buying S&P 500 futures over the past week to cover their shorts… and that’s why stocks have surged.

Normally, these stories about funds blowing up and causing a market disruption are little more than rumors created to explain a market that is defying fundamentals. But, markets defy fundamentals in the short term quite frequently without fund blowups.

This, however, is a bit of a unique case, because we can actually see the return data for this fund (it’s an open-ended futures fund). Over the past week, the fund has lost -14%. That has brought its year-to-date return to -13.5%, meaning prior to the last week, the fund was flat year to date. Taking a quick look at historical returns, a 14% weekly move in this fund is not normal, so it’s fair to say that something has gone very wrong there.

Looking more broadly, does the story of this fund explain why the market simply hasn’t been able to go down for a week (and why it suddenly exploded higher last Thursday despite the lack of anything good happening)? Yes, partially.

Even though I can’t directly validate the story, it reinforces my skepticism on this latest move higher from 2,300 in the S&P 500, and that is that this is a rally built on chasing and a squeeze.


Skip the jargon, arcane details and drab statistics from in-house research, and get the simple analysis that will improve your performance. Get a free two-week trial of the Sevens Report: www.7sReport.com.

How Big a Risk is a Trade or Military Dispute? February 16, 2017

An excerpt from the Sevens Report. Sign up for a two-week free trial of the full report at www.7sReport.com.

Earlier this week I began profiling non-political risks to explore when making decisions for your clients and talking with prospects. Here’s number three:

Non-Political Risk #3: Surprise Trade or Military Dispute

Surprisingly, and potentially dangerously, the market has fully embraced Trump’s pro-growth “big three” of tax cuts, infrastructure spending, and deregulation while totally ignoring the hostile trade (and to a lesser degree) military rhetoric—and that selective focus has helped fuel this rally in stocks.

How big a risk is a trade conflict with China?

Part of the reason investors have somewhat ignored the rhetoric is because they assumed that once Trump got into power, the realities of global trade would soften his tone. To a point, that has happened. Last week, Trump embraced the “One China” policy of governance over Taiwan. And, this past weekend visit with Japanese PM Abe came and went with no explicit mention of currency manipulation or unfair trade. But, while those are positives it’d be foolish to think there isn’t a real risk of a trade dispute/war with China.

Originally, the fear was that Trump would instruct the Treasury Department to label China a “currency manipulator” in its semi-annual currency report, due out in late March/early April. That would likely ignite some sort of a trade war as it would place automatic tariffs on Chinese goods. Obviously, that wouldn’t be good for stocks.

Trump appears to have backed away from such a direct confrontation, but as a WSJ article detailed, the administration is looking for a less “in your face” way to punish China for its trade practices (you can read the article if you’re really interested) but basically the strategy is to label currency manipulation an “unfair subsidy,” not just by the Chinese, but by every country. If that’s done, then individual US companies can lobby the Commerce Department to impose du-ties on competitive goods from countries they believe use currency manipulation. It’s basically a less-direct way to put duties/tariffs on Chinese goods.

Here’s the problem: Other countries can retaliate and do the same thing to the US, and cite the Fed’s ultra-low rates as manipulating the US dollar lower.

This will obviously be a fluid situation, but with Peter Navarro as the head of the National Trade Council (remember he wrote the book, Death by China) it’s un-likely that we won’t at least have a trade scare this year with China.

Looking militarily, the only real area of concern right now (well, there are multiple areas of concern, but the most pressing one) is the growing conflict between the US and China regarding their bases in the South China Sea. Trump advisor Bannon is particularly focused on this issue, and military officials have flat-out said that China won’t be allowed to operate a functioning naval or air base on these manufactured islands. Again, this is a low-probability event, but it remains a possibility.

Probability of a disruptive trade war? <30%. While the possibility is there, I’d expect marginal moves to try and correct trade imbalances with China, not all out tariffs or import duties (although I’m sure they will be publicly threatened, which will be negative for sentiment).

“Leading Indicators” and, “How do we position if it happens?” sections are restricted to subscribers.

Take advantage of the limited time special offer—if you subscribe to the Sevens Report today, and after the first two weeks you are not completely satisfied, we will refund your first quarterly payment, in full, no questions asked.

Copyright 2017, Kinsale Trading LLC. All Rights Reserved. www.sevensreport.com

What’s the Specific Word Trump Said That Sent the S&P 500 Through 2300 Last Week?

What’s the Specific Word Trump Said That Sent the S&P 500 Through 2300 Last Week?

Last week started off a little down on Monday, then flat on Tuesday and Wednesday. Thursday looked like it was going to be another boring day until President Trump made comments during an airline CEO meeting that he would present a “phenomenal” tax plan in a few weeks. Those comments were followed by a more legitimately positive article from The Hill that said Trump may be willing to cut entitlements to pay for tax cuts. Stocks jumped on the headlines and markets moved to all-time highs.

The momentum continued on Friday as political expectations continue to rise, and stocks rallied small in quiet trade. And with no news to break that momentum, stocks drifted higher into the close and with modest gains on the week.

What’s next? Find out first and keep your clients and prospects in the know. Sign up for your free trial of the Sevens Report and you’ll get all the market analysis in your inbox by 7am each morning. www.7sReport.com

A More Hawkish-Than-Anticipated Federal Reserve: February 15, 2017

An excerpt from the Sevens Report. Sign up for a two-week free trial of the full report at www.7sReport.com.

Yesterday I began profiling a couple of non-political risks to explore when making decisions for your clients and talking with prospects. Here’s the second:

Non-Political Risk 2: A More Hawkish-Than-Anticipated Federal Reserve

Profiling this risk seemed only natural, given Yellen’s Humphrey-Hawkins testimony yesterday, and her marginally hawkish comments served as a good reminder that the market is pretty complacent with regards to expected Fed rate hikes in 2017.

Yellen’s comments to the Fed on Tuesday, February 14th, were slightly hawkish.

Starting with Yellen, she was slightly hawkish in her comments mainly because of her upbeat assessment of the economy combined with her reiteration that waiting too long to hike rates would be “unwise,” and that the Fed will consider further increases at “upcoming meetings.” Finally, Yellen repeated that she expects a “few” rate hikes this year (she cited the median dots were three hikes in 2017).

While none of those comments were new, it was a reiteration that the economy is doing relatively well and that the Fed is focused on removing accommodation, and markets reacted slightly hawkishly as the dollar rose while Treasuries declined/yields rose.

From an equity standpoint, the fact that the Fed has not been hawkish so far in 2017 has helped stocks rally, as the 10-year Treasury yield has backed away from the 2.60% level. Above that we believe higher rates will start to become a headwind on stocks. But, there is clearly a risk that rates rise higher than current expectations, and as such we want to profile that risk.

Probability of 3 rate hikes this year (one more than expected)? > 50%. This is my opinion, and it’s higher than the current consensus, but to me it makes sense. If investors think that better growth is going to support the stock market, then why do they expect that acceleration in growth not to invite more interest rate hikes from the Fed? The answer is because the Fed has been ultra dovish for years, but I believe that is changing due to multiple factors.

First, growth is as good as it’s been in years. Second, dis-inflation/deflation is no longer a threat (we think this is an underappreciated change in the macro-economic dynamic). Even in ’13 and ’14, when growth had periods of acceleration, inflation was still trending downward and the Fed was in full QE mode. Now, inflation is trending upwards. Third, the composition of the Fed will change as Trump can nominate three Fed members this year, and it’s a good bet they will be more on the hawkish side. So, while it’s still Yellen’s Fed, the scales should start to tilt toward the hawks later this year.

“Leading Indicators” and, “How do we position if it happens?” sections are restricted to subscribers.

Take advantage of the limited time special offer—if you subscribe to the Sevens Report today, and after the first two weeks you are not completely satisfied, we will refund your first quarterly payment, in full, no questions asked.

Copyright 2017, Kinsale Trading LLC. All Rights Reserved. www.sevensreport.com

Economic Growth Slows: February 14, 2017

An excerpt from today’s Sevens Report.

Non-Political Risk #1: Economic Growth Slows.

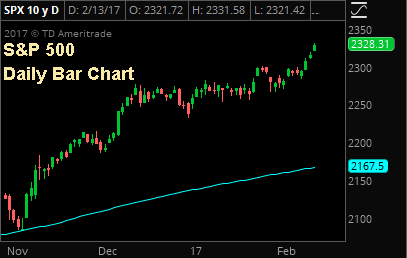
Stronger economic data remains an unsung hero of this post-election rally, and while Trump gets the headlines, it’s really the economic data that’s enabling this rally as better economic growth is allowing the market to continue to give Trump and the Republicans the benefit of the doubt.

I can go through the litany of reports, but whether it’s PMIs, the Jobs Report, or Business Investment, the data has been accelerating since mid to late 2016, and that’s created the proverbial “rising tide” that’s helped under-write both policy optimism and the rally in stocks.

But, while hope may be growing that there will be less drama from the administration (the reason for Monday’s rally), at the same time there’s growing evidence that actual policy reality will not meet market expectations.

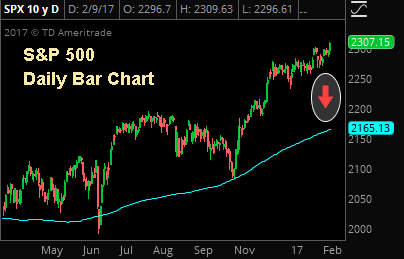
So, in the near term, it’s going to be up to economic data to continue to provide a reason for markets to give Washington the benefit of the doubt, otherwise the sober reality of a market that now trades well over 18X current-year earnings will begin to cause problems.

Bottom line, if economic growth slows in the near term, that will cause a pullback in stocks. So, in today’s Sevens Report for subscribers, I go into detail on: 1) How likely is an economic slow down? 2) What are the leading indicators to watch? and, 3) How do we position if it happens?

First, how likely is an economic slow down? > 50%.

A probability that high may surprise people, but I have several reasons for it: First, we’ve seen an acceleration in economic activity, but we still haven’t really achieved the “breakout” pace of consistent 3% GDP growth that tends to feed on itself and further stimulate the economy. For all the excitement, we’re still in a 2%ish GDP regime (GDP Now from the Atlanta Fed has Q1 GDP at 2.7% in Q1). Point being, things down have to slow very much before the economy is right back in neutral.

Second, the consumer has powered this economic acceleration, but the consumer is tired. Credit creation is slowing, and retail sales reports have been lackluster of late. To boot, the job market remains basically at full employment and while wages are rising, they aren’t rising fast enough to power incremental acceleration consumer spending. Unless we see proof consumers are accessing the equity in their homes, I don’t see what will cause consumer spending to grind higher.

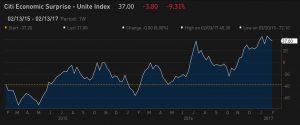
The Citi Economic Surprise Index rose steadily through Q4 of 2016 as economic data consistently beat expectations. Going forward, this index is now an important leading indicator for the market, as any material move back down towards zero will create a headwind on stocks.

Third, business investment has accelerated lately and that is good, but the uncertainty over the tax code changes (and trade in general) has the potential to be-come a headwind on business investment. Here’s my point: The tax changes being discussed in Congress could eliminate interest deductibility and change a host of other tax issues. If I’m a business and I’m thinking of getting a big loan to finance expansion, I’m likely going to wait until there’s more clarity on these and trade issues be-fore taking on too much risk.

Finally, leading indicator of growth for the global economy, China, is actively trying to slow its economy. China’s credit-fueled expansion back in February 2016 marked an inflection point in the global economy and things have been better since. But with a year of stimulus be-hind it, currency issues, and once again overheating property and asset markets, Chinese authorities are trying to cool their economy. The effects aren’t immediate or direct on the US economy, but the fact is that a slow-ing Chinese economy will become a headwind on the US at some point (how much of a headwind depends on how well the cooling is managed).

“Leading Indicators” and, “How do we position if it happens?” sections are restricted to subscribers.

Take advantage of the limited time special offer—if you subscribe to the Sevens Report today, and after the first two weeks you are not completely satisfied, we will refund your first quarterly payment, in full, no questions asked.

Copyright 2017, Kinsale Trading LLC. All Rights Reserved. www.sevensreport.com

S&P Hits Fresh All-Time-Highs

The S&P 500 gapped up to another all-time-high yesterday, underscoring the very strong bull market in stocks.

But, the current pace of gains in unsustainable and equities are due for a phase of consolidation.


Economic Cheat Sheet: February 13, 2017

Last Week:

There was very little incremental economic data last week, and what reports did come met expectations and importantly did nothing to change the perception that economic activity is legitimately accelerating—a perception that continues to support stocks broadly.

From a domestic data viewpoint, there isn’t a lot to talk about. Jobless claims continued to fall and hit another multi-decade low (a 43-year low), and that’s even more impressive when you consider how much the population has grown since then. Internationally, there was mixed data from China as their foreign exchange reserves dropped below the psychologically important $3 trillion level. While that was ignored by markets this week, China continues to bubble as a potential macro surprise in Q1/early Q2. These foreign currency reserves are a story we need to continue to watch.

But, January Trade Balance was much stronger than expected (exports up 7.9% vs. (E) 3.1%), and that data point early Friday helped alleviate some concern. Still, China’s currency reserves are declining, and authorities are actively trying to pull leverage from their economy and cool growth. More often than not, that leads to some sort of macro-economic growth scare—so just a heads up for the coming months.

Bottom line, economic growth remains an important pillar of this rally, and nothing last week changed that set up, which again was why at worst stocks were flat before the political headlines caused the late-week rally.

This Week:

As we’ve said, two of the biggest risks to the rally outside of Washington remain 1) Lackluster data and 2) A more hawkish Fed. Given those risks, the growth and inflation data this week is important.

Janet Yellen (AP Photo/Jacquelyn Martin)

However, the most important event of the week will be Fed Chair Yellen’s semi-annual Humphrey-Hawkins testimony to Congress, on Tuesday (the Senate) and Wednesday (the House). While she isn’t going to telegraph when the Fed will raise rates, her comments are still important considering the market remains complacent with regards to a Fed rate hike. There is no expectation of a March or May hike, and we continue to think the market is a little too complacent with regards to the potential for a May hike (we admit March seems remote).

Staying on the theme of Fed expectations, the next most important number this week is the January CPI report out Tuesday. The Fed does not believe inflation is accelerating meaningfully (due to the data), but if inflation does pick up pace that will be hawkish and will send yields higher—and most likely stocks lower.

Looking at growth data, Wednesday and Thursday are the key days to watch as we get January Retail Sales (Wed), Empire Manufacturing (Wed), January Industrial Production (Wed) and Feb. Philly Fed (Thursday). Of those four reports, the retail sales number is the most important, because consumer spending has been the engine of growth for the US economy, and it needs to maintain a decent pace because while business investment has picked up, it won’t offset a continued moderation in consumer spending.

The Empire and Philly Fed Indices are the next most important numbers next week, as they will give us the first look at February activity. Since better growth is a key support to this rally, they need to show continued strength. Neither number needs to accelerate meaningfully, but we can’t see much of a retracement, either. Bottom line, strong economic data and benign inflation data (Goldilocks numbers) have been an important support for this market as Washington reverts to the mean (gets more dysfunctional), and that needs to continue if stocks can hold recent gains in the face of confusing political headlines.

Get full Sevens Report delivered to your inbox each morning before 7:00am: http://www.7sreport.com/

Stocks Reach New Highs

The S&P 500 is now more than 6% above its 200 day simple moving average. And while the trend is clearly still bullish, the complacency in the market paired with the overextended conditions raise the chances of a pullback.


10 Year Note Yield Continues to Fall

The 10 Yr T-Note yield remains below the key 2.50% level and a considerable distance from the long term regression line which suggests a further correction is very plausible.