The Political Outlook for Stimulus is Darkening, February 28, 2017

This is an excerpt from today’s Sevens Report. The Sevens Report is the daily market cheat sheet our subscribers use to keep up on markets, seize opportunities, avoid risks and get more assets. Sign up for a free 2 week trial.

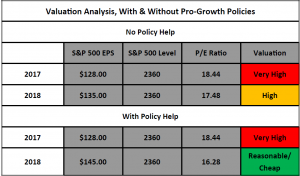
It’s obviously impossible to say “when” this will matter to stocks, but I want to make very clear to everyone that the political outlook for stimulus is darkening, and the chance of any pro-growth measures hitting the markets in 2017 are falling, quickly… and sooner or later that will be a problem for this market.

To that point, yesterday there were three separate areas where the outlook for fiscal stimulus darkened. First, while Treasury Secretary Mnuchin did a good job in both his major interviews (WSJ and CNBC) he didn’t add anything incremental regarding corporate tax cuts, and was downright vague on the idea of border adjustments, which is the key to corporate tax cuts.

Yes, he did say he expects a broad corporate tax reform bill by the August recess, but that’s just repeating what Speaker Ryan has said (i.e., nothing new). Bottom line, the outlook for corporate tax cuts in 2017 (and maybe at all) continues to get worse.

Paul Ryan

Speaker Paul Ryan has said he expects a broad corporate tax reform bill by the August recess. The outlook for corporate tax cuts in 2017 continues to get worse.

There were some additional headlines regarding this issue late yesterday afternoon when President Trump told Reuters he supported “some form of border tax.” Markets initially took this as a positive (implying he was supportive of border adjustments) but that’s premature because what he meant was unclear as his subsequent comments more implied he supported tariffs in some form (not the full scale border adjustments needed to pass corporate tax reform).

Beyond Trump’s comments, the major hurdle for border adjustments and corporate tax reform remains in the Senate. There is little support for that idea in the Senate currently, and until that chances, corporate tax reform is unlikely.

Second, Axios reported that Trump is punting infrastructure spending to 2018. That was treated as a notable headline yesterday, but we and others have been saying for weeks now that infrastructure spending never was on the table for 2017. So, while this isn’t an incremental negative for the market, it was a headline that we wanted to cover.

Third, as we’ve covered, the way things are looking right now Republicans must get the repeal/replace of Obamacare done before they can tackle corporate tax reform. Well, Politico reported that Republican Alaska Senator Murkowski won’t vote for any repeal/replace that reduces the Medicaid expansion. With just a 53/47 majority in the Senate, the chances of just getting 50 votes on a repeal/replace continue to dwindle, and by all reports Republicans remain fractured on how to handle the repeal/replace.

Now, I’m not pointing this out for political reason (you know I’m politically agnostic in this Report). The reason I am pointing it out is simple: No Obamacare repeal/replace, then no corporate tax cuts in 2017, and that’s a problem for stocks (how much of a problem will depend on economic growth, inflation and interest rates, but it’s still a problem).

Bottom line, I don’t want to sound like the boy who cried wolf, but I just want to point out consistently and clearly that the gap between market policy expectations and policy reality is widening—and again, that’s a risk that should not be ignored.

This is a volatile, politically sensitive investment landscape—you need the Sevens Report to stay ahead of the changes, and to calm worried clients.

The FOMC Expects a Rate Hike “Fairly Soon” – Here’s What We Think That Means. February 27, 2017.

This is an excerpt from today’s Sevens Report. You can get a free 2-week trial and see for yourself how the Sevens Report can give you fresh talking points for your client conversations, and help you outperform your peers. Read on to see our predictions for when the FOMC will announce the next rate hike.

There were only two notable economic events last week and neither were particularly positive for stocks (although they weren’t outright negatives). For weeks, the economic data has been supporting markets through consistent policy disappointment from Washington, so it’s notable that last week the data wasn’t particularly supportive, and incremental disappointment finally weighed slightly on stocks. Going forward, with policy outlook continuing to dim, data will need to be consistently good to further support this rally.

Last Week

Looking at last week’s data, the February flash PMIs (both manufacturing and service sector) were surprisingly disappointing. The flash manufacturing PMI declined to 54.3 vs. (E) 55.5, which was a surprise miss given the very strong Empire and Philly surveys from two weeks ago. The flash services PMI also missed estimates at 53.9 vs. (E) 55.9, again posting a surprise decline. Additionally, most of the details in these reports, including New Orders in the manufacturing PMI (which is a leading indicator), also fell. Meanwhile, the manufacturing input price index rose slightly while the selling price index declined slightly, implying margin compression in the manufacturing sector.

Now, to be fair, the absolute levels of these two PMIs remain high and by no means does the mild pullback imply a loss of economic momentum. However, the market needs consistently better data to offset the noise from Washington, and that didn’t happen last week.

The FOMC expects another rate hike "fairly soon," but it is unlikely to be in March 2017.

The FOMC expects another rate hike “fairly soon,” but it is unlikely to be next month.

The FOMC minutes were the other notable economic event last week, and while the minutes were taken as slightly dovish by the currency and bond markets, in reality they only confirmed that May is now (in our opinion) the next likely date for a rate hike.

The key phrase in the minutes was the FOMC expected another rate hike “fairly soon.” The reason that was taken as slightly dovish is because fairly soon isn’t the “next meeting” (that’s what has appeared in the FOMC minutes before the previous two rate hikes). The takeaway is that a March hike is unlikely, though that’s not incrementally dovish because the market wasn’t expecting a March rate hike anyway. If we get a strong inflation number this week and a strong jobs report Friday, odds of a March rate hike could creep closer to 50% from the current 22% (and that could be a headwind on stocks).

This Week

This will be a busy and important week for the economy as we get some critical data on growth and inflation, and if stocks can maintain this rally, the former needs to be strong and the latter doesn’t. The most important number this week is the PCE Price Index contained in Wednesday’s Personal Income and Outlays report. February CPI and PPI were both much stronger than expected, and if the Core PCE Price Index (which is the Fed’s preferred measure of inflation) moves close to 2% (currently at 1.6%) then we will see expectations for a March rate hike increase, and that will send Treasury yields higher and send the dollar higher—and that will put a headwind on stocks.

The next most important number this week is the ISM Manufacturing PMI, out Wednesday. Normally, this would be the most important number of the week, but even if this confirms last week’s flash PMI and pulls back a bit from January, it’s still a very high absolute level and it will take several months of declines before anyone would get worried about activity in the manufacturing sector. Nonetheless, it is still a critical number and if it’s soft we could see a bit of stock weakness.

There are other notable reports this week including Durable Goods (today) and the services PMI (Friday). Finally, revised Q4 GDP comes Tuesday, and analysts are still looking for around 2% growth (Q4 GDP was 1.9% in the advanced look last month). As we said, all the data is important given strong data has helped offset growing policy worries, so these number meeting or beating estimates will be generally supportive. Bottom line, data needs to stay good and inflation needs to stay tame in order to support this market, because Washington policy expectations are a growing headwind.

Join hundreds of advisors from huge brokerage firms like Morgan Stanley, Merrill Lynch, Wells Fargo Advisors, Raymond James and more… see if the Sevens Report is right for you with a free 2 week trial.

Oil Market Internals Confirm Our View of “Lower-for-Longer” Price Environment, February 24, 2017

This is an excerpt from today’s Sevens Report. Sign up for your free two-week trial to get everything you need to know in your inbox, by 7am in 7 minutes or less.

We have recently been monitoring the calendar spreads and term structure of WTI crude oil futures with a little more attention, as there have been notable developments.

As a refresher, a calendar spread is simply the difference in price between two contracts with different expirations. For example, contracts with a December ’17 expiration are currently trading at a roughly $1.00/bbl premium to contracts expiring in December ’18 (this is called an inverted market, or backwardation, and is not typical in energy markets). Normally, back-month con-tracts are more expensive than front-month contracts to reflect the price of storage and other variables. Such a structure is called normal contango.

The trend is long-term bearish oil.

The trend is long-term bearish oil.

Over the last week or two, calendar spreads have surged, which would be considered very bullish in normal market conditions like we had late last year when OPEC announced their agreement to cut production with several large NOPEC producers. After that announcement, the entire WTI expiration curve rallied on the speculation of that bullish development in the supply-demand fundamentals with front-month contracts out-performing back months (calendar spreads rallied, con-firming the move in active-month futures).

In the current case, the strength in the calendar spreads has been the result of weakness in back-month contracts like December ’18. Think about the simple equation a – b = c (calendar spread). If “a” (Dec ’17) and “b” (Dec ’18) are both increasing, but the pace of a’s increase is faster, “c” will be positive (so the calendar spreads would be rallying, which is bullish). Right now, “c” is rising because of a faster decline in “b” than in “a” and that is far less of a reason to be optimistic on this current, sluggish trend higher in oil prices.

Stepping back, this development in the calendar spreads confirms what we have been saying, and that is we remain in a lower-for-longer price environment in the energy market.

The logical reason for a faster decline in back-month contracts such as December ’18 expiration suggests that US producers are hedging out future production for wells they have either just brought online or are in the process of bringing online. And this concept supports our idea that US production has not only bottomed, but has begun a cyclical move higher.

Bottom line, that trend is long-term bearish oil for two reasons. First, the obvious fact that rising US output will offset the efforts of the production cut agreement overseas is supply side bearish. Second, OPEC producers are not likely going to be comfortable with the idea of losing market share to the US again (after all, that is the reason they switched to “full-throttle” policy back in summer 2014, which led to the near-80% plunge in oil prices over the subsequent 18 months). The more market share OPEC loses to the US the more likely their compliance to individual quotas will begin to fall, which is very bearish for prices as that is what this current recovery into the $50s is fundamentally based on.

Looking ahead, we could very well see a continued run higher towards our initial target of $57.50, or to our secondary target of $60/bbl, as optimism surrounding OPEC compliance remains elevated. The longer-term outlook is not so bright, and the low $50s will likely remain a “magnetic” level for WTI futures.

The Sevens Report is the daily market cheat sheet our subscribers use to keep up on markets, seize opportunities, avoid risks and get more assets. Sign up for a free 2-week trial today.

What The Oil Market Internals Are Telling US

While active, front month oil futures are threatening to break out to new highs for the year, back month futures are in clear downtrends, which is longer-term bearish for the energy complex.


Real Economics vs. Trump’s Washington Buzz

As has been the case since the election, the political noise in the market is deafening.

But cutting through that noise, the reality is this: The gap between market expectations from Washington and the current reality has grown significantly in the month since Trump’s inauguration, and it is not an understatement to say that political disappointment risk is now very high.

Is Trump News Affecting Markets?

Specifically, Trump noise aside, all signs point to massive fractures in the Republican Party over the repeal/replace of Obamacare, and over border adjustments (the key to any material corporate tax reform).

To boot, the constant drama and infighting is draining Trump’s political capital even before we get close to deals on Obamacare and taxes. Specifically, the immigration ban battle, the Gen. Flynn drama, and the Puzder (the Labor Secretary nominee) withdrawal (where a full 12 Republican Senators would have voted against him) all are combining to reduce the likelihood of anything substantial on taxes.

Bottom line, the only thing politically that really matters to markets is tax cuts. But given the fractures appearing on Obamacare and border adjustments, the likelihood of material, pro-growth policy is fading… and fast.

Last week, Trump again touted fantastic things coming up, and Ryan promised an Obamacare repeal/replace by the end of February. Yet neither actually mean any progress (for that we need Republican support for bills in the Senate, and that’s lacking).

Going forward, a key date emerging on the calendar is February 28, when Trump is due to give an address before Congress (first year Presidents give this address instead of a State of the Union).

If there is no material progress on a compromise on a Obamacare repeal/replace or border adjustments within corporate tax reform by this address, then the political reality could begin to weigh on markets as investors begin to lose hope of pro-growth reforms in 2017.

Cut through the noise and understand what’s truly driving markets, as this new political and economic reality evolves with the Sevens Report. Get a free two-week trial: www.7sReport.com.

“Is the Stock Market Too Expensive?” February 23, 2017

“Is the Stock Market Too Expensive?” 

That’s a question I’m getting asked a lot lately by subscribers and colleagues.

With stocks at record highs, there is a lot of worry that the market is unsustainably expensive. But, that’s simply not the case.

Yesterday, in the full edition of The Sevens Report, we broke it down.

  • Provided a three-part analysis of what makes the market 1) Expensive, 2) Fairly Valued (with some room for upside) and 3) Cheap
  • Named each catalyst that would decide that valuation level
  • Listed specific sector and style ETFs that we believe can outperform in this valuation environment.

Excerpt from that research below:

Valuation Update: How Overvalued Are Stocks?

It’s no secret that stocks are richly valued, but while those high valuations make me generally uncomfortable (I’m a value investor at heart) I do feel the need to push back a bit on the idea that valuations, alone, are a reason to lighten up on equity exposure.

Yes, in some scenarios the stock market is simply “too expensive.” Still, there are other, more plausible scenarios where I can show the market as reasonably valued or even cheap. Here are a few of those scenarios.

The Market is Too Expensive If: You’re Looking at Current Year Earnings. Looking at current year earnings, the S&P 500 is historically very expensive. With consensus $128 2017 S&P 500 EPS, the S&P 500 is trading at a whopping 18.44X current year earnings. Anything above 18X has proven (longer term) historically unsustainable.

The Market Is Not Too Expensive (Yet) If: You Look At Next Year’s (2018) Earnings (And This is Without Any Tax Cuts). Consensus 2018 (so next year) EPS are around $135, which does not include any benefit from a corporate tax cut. At $135, the S&P 500 is trading at 17.4X next year’s earnings. Yes, that is expensive (the 20-year average is 17.2X per FactSet) but it’s not unsustainable, not in an environment with historically low interest rates and an apparent macro-economic acceleration.

In fact, if the macro set up doesn’t change (and we don’t get any definitively bad news from Washington), I could see investors pushing that multiple to 18X, or 2,430 in the S&P 500 (about 3% higher from here).

Above that, I think the market would get somewhat prohibitively expensive, but that would depend on what’s happening with the economy, inflation and rates.

The Market Is Cheap If: Real, Material Corporate Tax Cuts Get Implemented. If we do get material corporate tax cuts in 2017, most analysts think that would add at least $10/share to S&P 500 EPS, bringing the 2018 number from $135 to $145.

At $145 EPS, the S&P 500 would be trading at just 16.3X next year’s earnings, which in this environment could easily be considered reasonable if not outright cheap.

“Is the stock market too expensive?”

Six Value ETFs That Can (and Have) Outperformed

From a practical standpoint, the fact that the stock market is on the expensive side historically does reinforce my preference for value-oriented ETFs. Since late 2016, we’ve focused our tactical strategies on sectors we considered a “value” and they have handily outperformed the S&P 500:

  • In September of 2016, we strongly advocated getting long banks due to 1) Compelling valuation and 2) The start of the uptrend in bond yields. Since that call on September 26, our preferred bank ETF has risen 41%!
  • In late 2016, while many analysts were chasing cyclical sectors in the wake of the election, we instead advocated buying value in super-cap internet stocks. Our preferred internet ETF has risen 9.8% in 2017, handily outperforming the S&P 500.
  • At the start of 2017, we cited the maligned healthcare sector as our preferred contrarian play for 2017, based on the idea that overly negative political fears had created a value opportunity. Our two preferred healthcare ETFs have risen 7.3% and 7.5% so far in 2017, and we think that trend of outperformance will continue. 
  • More broadly, we have identified two “Value” style ETFs that we believe will outperform the markets in this current macro-environment, and these two broad ETFs remain our preferred vehicle to be generically “long” the market.

The Sevens Report doesn’t just help you cut through the noise and focus on what’s truly driving markets – we also provide tactical idea generation and technical analysis to help our subscribers outperform. You can sign up for your free trial today: www.7sReport.com.

“This is a huge value add. If I can avoid even a modest portion of significant market pullbacks, and be well-invested during bull markets based on your Dow Theory calls, my clients will be extremely happy with me. I already look like a genius to them!” – Financial Advisor with a National Brokerage Firm, New York, NY. 

10 Year T-Note Yield Remains Pinned

The 10 year yield remains effectively pinned between 2.30% and 2.60% as Fed policy outlook is as unclear as current fiscal policy outlook.


Disappointing Numbers from Flash February Manufacturing & Service PMIs: February 22, 2017

Below is an excerpt from the “Economics” section of the Sevens Report. The Sevens Report has everything you need to know about the markets by 7am each morning in 7 minutes or less—can get a free trial if you sign up now.

Flash February Manufacturing & Service PMIs

  • Feb. Manufacturing PMI declined to 54.3 vs. (E) 55.5.
  • Fed. Service PMI declined to 53.9 vs. (E) 55.9.

Takeaway

In what was a surprising contradiction to last week’s very strong Empire and Philly manufacturing PMIs, both flash PMIs declined, and implied increased stagflation risk, signaling that further economic acceleration is not a foregone conclusion.

Now, to be clear, neither number was outright bad in an absolute sense. Both numbers in aggregate are reflective of a decently strong economy. Yet in order to power stocks higher in the context of growing political dysfunction, data needs to continue to show acceleration, and neither of these flash PMIs showed acceleration.

Declines in Nearly Every Sub Index of the PMI

Looking specifically at the manufacturing PMI, New Orders, the leading indicator in the Report, dipped to 56.2 from 57.4 (still a very high absolute reading but a decline nonetheless). In fact, virtually every sub index declined in February except for input prices, which rose slightly to 56.1 from 56.0. Notably, output prices (i.e. selling prices) dipped slightly to 51.7 vs. 51.9, which is indicative of margin compression. One number doesn’t make a trend, but that’s something to keep an eye on.

Bottom line, the flash PMIs are one of the bigger economic numbers each month, and this was a surprising disappointment. It won’t change the trajectory of the rally near term, but strong (and stronger) economic data is a critical support to this market, especially in the face of growing doubts in Washington. So, the rest of February’s data just got a lot more interesting.

Get the simple talking points you need to impress clients and prospects. Sign up for your free trial today: The Sevens Report.

Natural Gas Futures Plunge

Natural gas futures plunged 9% to settle at a 6-month low yesterday as speculative longs “threw in the towel” on bets that colder than average temperatures might spur elevated demand in the back half of winter.


Economics: This Week and Last Week. February 21, 2017

An excerpt from today’s Sevens Report. Subscribe now to get the full report in your inbox before 7am each morning.

Both economic growth and inflation accelerated according to last week’s data, and while the former continues to help support stocks despite a darkening outlook from Washington, the latter also is increasing the likelihood of a more hawkish-than-expected Fed in 2017, and a resumption of the uptrend in interest rates. For now, though, the benefit of the former is outweighing the risk of the latter.

If, however, we do not see any dip in the data between now and early May, I do expect the Fed to hike rates at that May meeting, which would be a marginal hawkish surprise. To boot, if we get a strong Jobs report (out Friday, March 3), then a March rate hike two weeks later isn’t out of the question. Point being, upward pressure is building on interest rates again.

Last Week

Both economic growth and inflation accelerated according to last week’s data.

Looking at last week’s data, it was almost universally strong. Retail Sales, which was the key number last week, handily beat expectations as the headline rose 0.4% vs. (E) 0.1% while the more important “Control” retail sales (which is the best measure of discretionary consumer spending) rose 0.4% vs. (E) 0.3%. Additionally, there were positive revisions to the December data, and clearly the US consumer continues to spend (which is more directly positive for the credit card companies).

Additionally, the first look at February manufacturing data was very strong. Empire Manufacturing beat estimates, rising to 18.7 vs. (E) 7.5, a 2-1/2 year high. However, it was outdone by Philly Fed, which surged to 43.3 vs. (E) 19.3, the highest reading since 1983! Both regional manufacturing surveys are volatile, but clearly they show an uptick in activity, which everyone now expects to be reflected in the national flash PMI.

Even housing data was decent as Housing Starts beat estimates on the headline, while the more important single family starts (the better gauge of the residential real estate market) rose 1.9%. Single family permits, a leading indicator for single family starts, did dip by 2.7%, but even so the important takeaway from this data is that so far, higher interest rates don’t appear to be negatively impacting the residential housing market, and a stable housing market is a key, but underappreciated, ingredient to economic acceleration.

Finally, looking at the Fed, Yellen’s commentary was marginally hawkish, as she was upbeat on the economy, basically saying the nation had achieved full employment and was closing on 2% inflation, and reiterated that a rate hike should be considered at upcoming meetings. None of her comments were new, but the reiteration of them reminds us that the Fed is in a hiking cycle, and the risk is for more hikes… not less.

This Week

The big number this week is the February global flash manufacturing PMI, out Tuesday. With last week’s strong Empire and Philly Surveys, expectations will be pretty elevated for the flash manufacturing PMI, so there is some risk of mild disappointment. On the flip side, if this number is very strong (like Empire and Philly) you will likely see a hawkish reaction out of the markets (dollar/bond yields up) and the expectation for a rate hike before June increases. That, by itself, shouldn’t cause a pullback in stocks, but upward pressure will build on interest rates.

Outside of the flash manufacturing PMIs, the FOMC minutes from the January meeting will be released Wednesday, and investors will parse the comments for any clues as to the likelihood of a March increase. Yet given the amount of political/fiscal uncertainty, and considering the FOMC meeting was before the strong January jobs report and recent acceleration in data, I’d be surprised if the minutes are very hawkish (although given they are dated, I don’t think that not-dovish minutes reduces the chances of a May or even March hike).

Bottom line, the focus will be on the flash manufacturing PMIs, and a good number this week will be supportive for stocks.

Join hundreds of advisors from huge brokerage firms like Morgan Stanley, Merrill Lynch, Wells Fargo Advisors, Raymond James and more… see if the Sevens Report is right for you.