Join hundreds of advisors from huge brokerage firms like Morgan Stanley, Merrill Lynch, Wells Fargo Advisors, Raymond James and more… see if The Sevens Report is right for you.
Trading yesterday was driven by multiple political-related headlines. Politics reasserted itself on the market narrative on Wednesday, helping stocks initially rally following renewed hopes for an Obamacare repeal/replace bill, and after the Trump Administration unveiled a significant (though expected) tax cut plan.
Yet despite the media focus on those two events, any actual progress with healthcare or taxes remains unlikely (and didn’t get better yesterday). The third piece of political news, an investigation into aluminum imports by the Commerce Department, was the most important (yet underfollowed) political development for markets yesterday.
I cover each issue below, cut through the noise, and get to any likely market influence. The bottom line is that despite generally favorable headlines, all the political news yesterday was a mild net negative for stocks.
Trump Administration Tax Cut Plan.
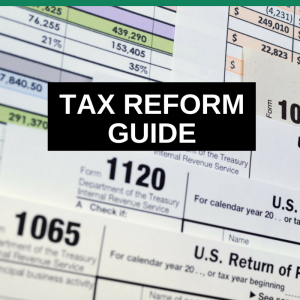
What Happened: The Trump Administration unveiled a sweeping tax cut proposal that included a 15% corporate rate, just three individual tax brackets, doubling the standard deduction, and repatriating overseas profits.
Why It Matters: Corporate tax cuts remain the easiest catalyst for a stock breakout, but unfortunately the tax plan revealed yesterday is very unlikely to pass Congress, and the reason is simple: There is no offset to the reduced revenue from lower taxes. As such, this plan will increase the deficit, and that likely means Democrats can filibuster the bill. Going forward, unless a tax plan contains some material offsets to reduced taxes (like border adjustments) then passage of any big tax cuts remains unlikely in 2017, and that’s stock negative.
How Markets Reacted: Tax-related headlines can still cause a pop in markets, but only a credible plan that can pass Congress will be a bullish gamechanger. (For more market insights in your inbox by 7am each morning, sign up for a free 2-week trial at 7sReport.com.)
Healthcare Bill (Obamacare repeal/replace).
What Happened: The details were fast and furious on this yesterday, but as of this writing it appears the House will vote on the bill potentially this weekend, and odds of passing are decent.
Why It Matters: Passage of an Obamacare repeal/replace increases the chances of tax cuts also passing, as it will increase Trump’s political capital and provide more revenue to offset tax cuts. However, even if this bill passes the House, the chances of passage in the Senate in the current form remain slim. So, while a potential moral victory, it won’t significantly increase the chance of healthcare reform, and as such I don’t see it as a bearish gamechanger for healthcare ETFs (XLV, IHF, IBB).
How Markets Reacted: Stocks (including health care names) largely ignored this news, as again the likelihood of any Obamacare repeal/replace becoming law remains slim. (For more market insights in your inbox by 7am each morning, sign up for a free 2-week trial at 7sReport.com.)
Tariffs and Trade.
What Happened: Yesterday the Commerce Department announced an investigation into aluminum imports. No tariffs were announced, but it certainly looks to be moving in that direction. This announcement comes one day after Commerce levied taxes on Canadian soft lumber imports. Additionally, a Politico story hit midmorning that President Trump was close to signing a document notifying Mexico and Canada that the US intends to withdraw from NAFTA within six months. The document does not guarantee a US exit (they can change course), but it is a necessary legal step to begin the process. Since yesterday the White House has said it’s not preparing this document yet but didn’t squash the idea all together.
Why It Matters: These trade events yesterday (and this week) are actually the most important political events of the week, not because of their immediate impact (Canadian lumber and aluminum tariffs don’t mean a trade war, and the NAFTA announcement is likely for negotiating leverage), but it does remind markets of Trump’s potentially disruptive trade policies. That matters, because right now markets have not priced in any trade-related headwinds, so this does represent at least a modest risk to the bullish narrative.
How Markets Reacted: All the trade headlines weighed slightly on stocks during the late afternoon, but the current headlines simply aren’t bad enough to warrant an outright reversal in stocks. (For more market insights in your inbox by 7am each morning, sign up for a free 2-week trial at 7sReport.com.)
Bottom Line on the Political Update for Investors:
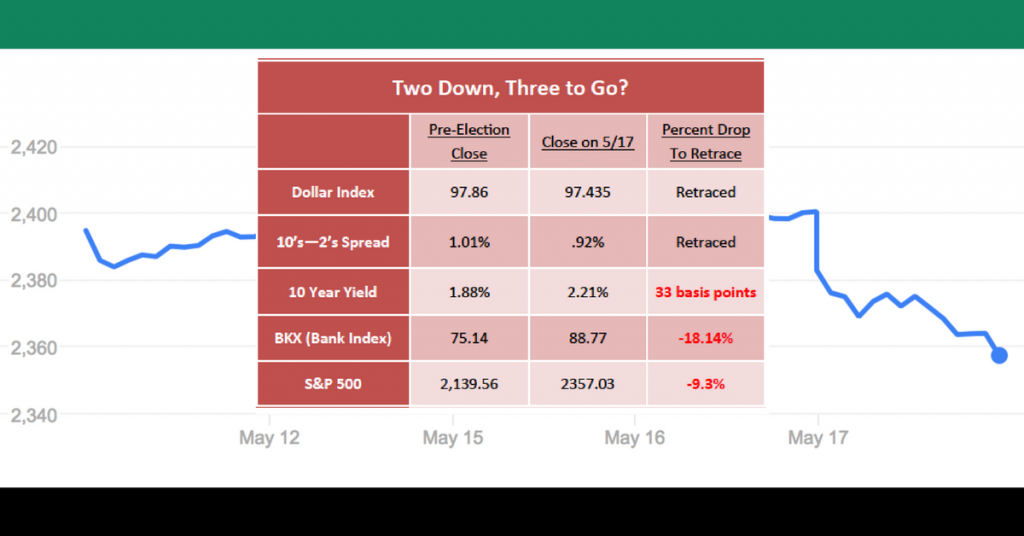
Material “gaps” remain that must be filled if the S&P 500 can sustain a meaningful breakout above 2400, including 1) The gap between political expectations and political reality, 2) The gap between too-low Treasury yields and very high stock prices (although that’s narrowed some-what this week, but not enough), and 3) The gap between soft economic surveys and hard economic data.
In the very short term, investor sentiment seems skeptical, and the market acts as though investors are more afraid of missing a breakout than they are a break down (similar to what we saw when the S&P 500 broke through 2300). So, the “pain trade” looks higher short term and that’s helping stocks.
But given valuations (the S&P 500 trading nearly 18X 2018 earnings), I don’t think sentiment alone is enough to push us decidedly through 2400 without positive resolution on some of these gaps. That means we need 1) Actual progress on tax cuts (which didn’t happen yesterday), 2) A rally in the 10 year above 2.40%, or 3) Better economic data starting today.
I am therefore sticking with my call that the 2300-2400 broad trading range in the S&P 500 should hold, and I would not be chasing stocks at these levels.
Cut through the noise and understand what’s truly driving markets, as this new political and economic reality evolves. The Sevens Report is the daily market cheat sheet our subscribers use to keep up on markets, seize opportunities, avoid risks and get more assets.
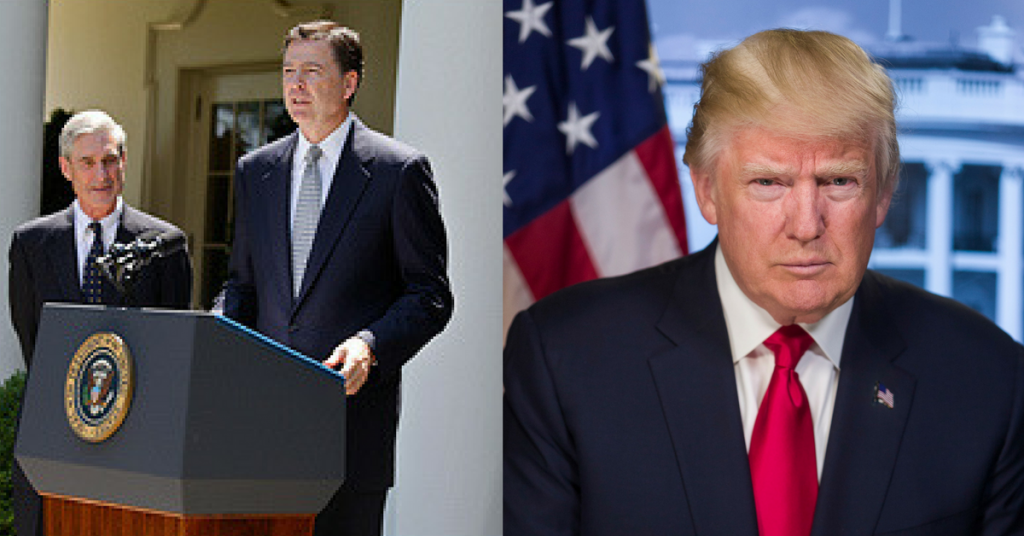 Case in point, Tuesday’s firing of FBI Director James Comey moved markets yesterday, and I wanted to cover what that means going forward (it’s a mild and potentially negative, but not a bearish game changer). Now, to be clear, the market is agnostic to the politics of this drama and as such so am I. Whether you or I think the firing was a coverup or justified, it matters not from a market standpoint, so as I always do with political coverage, I will strictly stick to market implications.
 Second, tax cuts will be a bearish gamechanger if the market begins to believe: 1) They won’t happen at all, or 2) They will be so small that it won’t make a difference. Point being, tax cuts can be delayed in 2018 and it won’t be a bearish game changer as long as the market still expects that rate to be cut to 20% or lower.