How Many Rate Hikes in 2017? Last Week and This Week: March 5, 2017
The Economics excerpt from today’s Sevens Report, which focuses on the most important financial news and takeaways for investors, financial advisors, and CPA’s, last week and this week.

Even uber-dove Lael Brainard supported potentially hiking in March.
Last Week:
The major takeaway from the economic data and Fed speak last week is that because of continued strong data and hawkish Fed speak, a March rate hike now is expected by the markets. Probability (according to Fed Fund futures) of a rate hike on March 15 rose from just over 20% two weeks ago, to over 70% at the end of this week… and that was a legitimate surprise for markets.
The reason that change didn’t cause a pullback in stocks is simple. Economic data last week showed continued acceleration in growth and inflation, and as such that helped cushion the blow from the increased rate hike expectations.
To that point, there were three big numbers from last week and they all beat estimates. February ISM Manufacturing PMI rose to 57.7 vs. (E) 56.4, February ISM Non Manufacturing PMI rose to 57.6 vs. (E) 56.5. And, the core PCE Price Index (the Fed’s preferred measure of inflation) rose 0.3% in February, the biggest monthly increase since January 2016. While the core PCE Price Index rose 1.7% yoy, same as January, the headline PCE Price Index rose 1.9% yoy, just below the Fed’s 2% target and the highest level since February 2013!
Not every economic data point was strong last week (Pending Home Sales missed estimates as did Core Durable Goods. And, headline revised Q1 GDP was a touch light at 1.9% vs. (E) 2.1%). Still, the good data handily outweighed the bad data.
Bigger picture, it’s hard to understate how important continued good economic data has been for markets in 2017. Strong data has helped buy Washington more time on corporate tax cuts, and now it’s helping to cushion the blow from a potentially more hawkish Fed. Strong economic data continues to be the unsung hero of the 2017 stock rally, and it needs to continue given the increasingly bleak policy outlook, and potentially a more hawkish Fed. Frankly, watching and correctly interpreting economic data hasn’t been this important in years.
Looking at Fed speak from last week, it was almost universally hawkish. Clearly the Fed is trying to pave the road for a March rate hike. Fed officials Williams, Dudley and Powell all signaled that a rate hike could come in March, and even uber-dove Lael Brainard supported potentially hiking in March.
Then, as if there was any doubt left by the end of last week, on Friday Fed Chair Yellen basically said that if the jobs report is in line, the Fed is hiking rates (her exact words were more general, and a bit more eloquent, but that was her point).
Bottom line, the Fed appears to be sticking to its promise of three rate hikes in 2017, with the first likely coming in 10 days.
This Week:

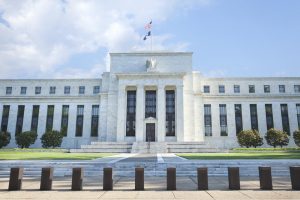
Are Janet Yellen and the other members of the Fed supporting more rate hikes in 2017?
Jobs reports are always important economic releases but due to the potential for a March rate hike, this jobs report is even more important than normal because it will decide whether we get a hike next Wednesday.
As usual, it’s jobs week, so that means we will get the ADP report on Wednesday, weekly jobless claims on Thursday (which continue to hit levels last seen since the 1970s), and the official jobs report Friday.
I’ll do my normal “Goldilocks” jobs preview later this week, but the bottom line is that as long as this jobs re-port remains firm, the Fed will hike rates next week.
Outside of the jobs report, it’s actually a pretty quiet week, economically speaking.
In the US, the only other notable report is Productivity (out Wednesday). Low worker productivity has been a major downward influence on inflation, but it’s shown signs of ticking higher lately. A continuation of that trend will be slightly hawkish. Finally, looking internationally, China will be in focus as we get Trade Balance (Tuesday) and CPI/PPI Wednesday.
Data from China has been consistently decent (including last week’s February manufacturing and composite PMIs), so it’ll be a big surprise if the data suddenly turns south, but China remains a macro area to watch as any hints of a slowdown will make waves for global markets.
Bottom line, this week really is all about the jobs report. If it’s close to in line, the Fed will hike next Wednesday. And, if it’s hotter than expected, get ready for talk about more than three hikes this year (and that idea is a risk to stocks).
Cut through the noise and understand what’s truly driving markets, as this new political and economic reality evolves. Start your free 2-week trial of the Sevens Report today.