Posts

How Far Could Stocks Go? Let’s Look at the Charts. March 2, 2017

How Far Could Stocks Go?

Stocks have screamed to all-time highs in recent weeks, and with new highs always comes the question of how far could stocks go? We like to regularly offer fundamental valuation updates as we did two weeks ago, but it is also important to outline what the charts are telling us as far as upside targets and key support levels for near-term price movements.

This stock market technical update is an excerpt from our March 1st Sevens Report. Claim your free 2-week trial today and cut through the jargon to specifics to support your client conversations. 

In the wake of the election there were a lot of very important technical developments. The two most notable were the shift from a bear market signal to a bull market signal in Dow Theory when the S&P was trading at 2165, and confirmation of that signal when the S&P broke to all-time highs November 21.

Currently, both the technical trend and upside momentum of the market continue to suggest the path of least resistance is higher for the medium term. That is the case in spite of the fact that there are countless fundamental uncertainties, most important are related to politics and fiscal policy.

Prices taken at market close on Feb 28.

Prices taken at market close on Feb 28.

In a situation like this, where technicals are largely divergent from fundamentals, many financial professionals and investors look for some direction as to how far stocks could rally from current levels and where a pullback would most likely pause if not reverse. So, we put together a few upside targets as well as downside support levels to watch for the S&P 500.

In a quick review, when any issue (stock, bond, commodity or currency) is trading in never-before-seen territory, there are only two ways to come up with targets in the direction of the new highs—measured moves, and likely areas of interest for options traders. The latter is relatively easy to figure out, as options volumes generally cluster around the big round numbers (in this case 2350 and 2400).


Tracking Measured Moves.

Measured moves, on the other hand, are a little more scientific. The idea behind a measured move is that if the market moved a certain distance against the dominant trend, it will more than likely move at least that far back in favor of the trend once it resumes.

  • Our next upside target is actually a combination of two measured moves and a likely area of interest for S&P option traders: 2450. On the daily chart, a measured move can be calculated from the late-October lows (2084) to the late-December digestion area (2271), which results in a measured move to 2458 in the S&P from current levels. In a supporting fashion, a measured move on the weekly chart can be calculated from the previous S&P highs of 2126 to the February ’16 lows of 1810. That results in a target of 2442.
  • This gives us an ultimate target window of 2442-2458, which encompasses a likely options trader target of 2450.

stock market charts, March 2

  • Bottom line, we are not suggesting that this bull market will end in the mid 2400s; however, for those looking to take profits, you likely will not be alone in doing so in that window around the 2450.

Support Levels

Turning to support levels, the February melt-up in stocks has left a large “volume gap” on the chart, which basically means stocks sprinted from around 2300 to 2360. Because of the velocity of that move higher, there were not many logical support levels created in the month of February. And a set up like that raises the odds that there could be a swift move back through that area.

  • There is an initial and minor area of support around 2343, where there was minor consolidation on February 16. This area will at least be noticed by technical traders and volume-driven algorithms.
    Secondary and more formidable support lies near the previous set of new all-time highs established in December in the band between 2270 and 2280. Here there will be buyer support from both bulls who missed out on the breakout as well as faster-money short sellers looking to book profits.

March 2, book profits

  • Our final support zone is derived from a weekly timeframe, and again at a previous all-time high of 2100, where the most consolidation occurred since the tech sell-off finally ended in 2002.

These levels are meant to provide you with a general idea of the most important technical levels on either side of the broader stock market right now. This information, we have heard in the past from advisor subscribers, is very useful in conversations with clients.

Join hundreds of advisors from huge brokerage firms like Morgan Stanley, Merrill Lynch, Wells Fargo Advisors, Raymond James and more… see if the Sevens Report is right for you with a free 2 week trial.

Why It’s Time to Buy Insurance—Right Now! March 1, 2017

This is an excerpt from today’s Sevens Report. To get your free 2-week trial, sign up now!

The Practical Takeaway from Low Volatility

One of the bigger conundrums right now is that volatility in the stock market is plumbing multi-year lows despite the presence of multiple major and binary events that will resolve themselves positively or negatively in the coming months.

Some examples (just to name a few): When/if we will get corporate tax reform? Will the US institute tariffs? Will interest rates continue to move higher? Is inflation finally back?

Each of these events could easily cause a pullback in stocks of at least 10%, yet investors seem unimpressed. Case in point, the VIX recently hit 9.97, which is a multi-year low.

Now, the obvious question is… “Why is implied volatility so low?”

First, implied volatility is low because the macro-economic backdrop has been supportive, and stocks have relentlessly gone straight up since November. This has been the longest stretch without a 1% decline in decades.

However, there is a second reason.

The lack of volatility has invited investors and funds to sell options (specifically puts) and collect premium. Given the lack of volatility, that’s been a profitable strategy, and it has invited more competition.

So, more investors selling options (i.e. selling volatility and collecting premium) pushes the price down, and that’s why implied option volatility (which is what the VIX is based on) has dropped extra low.

Normally, this would catch my attention, but a conversation I had with a friend in the insurance business made me both intrigued and concerned that this inherent “complacency” is prevalent throughout the economy. Here’s why.

It's time to buy insurance.

I’ve almost never been an advocate of buying puts… yet buying puts to preserve market performance may not be a bad idea.

He said in his entire career, commercial and property insurance rates have never been lower than they are now.

And, if you think about it, I guess that makes sense.

I started my conversation with him because I asked my friend if my property insurance would go up because of Hurricane Matthew last year, and he said, “No way.”

He went on to tell me that the insurance companies are so flush with cash, they are just dying to write contracts to take in premium, and with so many competitors out there, it’s caused the price of insurance to drop sharply.

Empirically, that makes sense. With bond yields so low, insurance companies need to generate income and writing insurance over the past several years has been profitable (broadly speaking, we haven’t had any major disasters for the non-health insurance business).

But at this point, my friend remarked that it’s getting a bit ridiculous, as insurance companies are taking on a lot of exposure just to collect a little bit in premium (at least according to his experience).

Practical Takeaways

First, don’t assume that a low VIX means a drop in the stock market is looming. Implied volatility can’t get much lower, but it can stay down here for a while.

Volatility stayed around these levels for about two years in the ’93-’95 period, and again in the ’05-’07 period. Point being, low VIX is not a reason to expect a correction.

Second, insurance in the market (i.e. puts) is cheap, so we should consider buying insurance (i.e. buying puts).

As I said in Monday’s report, I’m almost never been an advocate of buying puts because I hate buying insurance.

Yet given we could easily see an air pocket open up in this market if corporate tax reform dies, or the Fed hikes rates in March, buying puts to preserve performance may not be a bad idea.

For less-experienced options investors, just buying near-the-money puts here might make sense.

For more experienced options investors, buying an at-the-money put and selling an out-of-the-money put may be attractive.

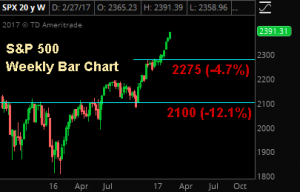
Here’s my logic. We think there’s strong support for the market around 2275, so as long as fundamentals are generally “ok,” we’d be ok buying the S&P 500 at that level.

So, we could sell 2275 puts (meaning we’d get put the stock at that level) and then use those proceeds to reduce the cost of an at the money put, say at 2370. That way, we’ve insured ourselves against any 5% or less drop in stocks, and also have the opportunity to buy the mar-ket cheaper at a level we’re comfortable with.

Third, actual insurance appears cheap, so I’m re-pricing life insurance and other insurance to try and lock in low prices.

Finally, generally, the idea that low yields and a chase for income is pushing both investors and insurance companies to increase exposure in exchange for reduced compensation is making my blood pressure go up.

As we’ve all seen, this can last for a long time, so it doesn’t mean a calamity is around the corner. Still, we all know that’s the kind of anecdotal behavior that leads to nasty consequences. Here’s to hoping it’s different this time.

For a monthly cost of less than one client lunch, we firmly believe we offer the best value in the independent research space. Subscribe to your free 2-week trial of the Sevens Report now.

The Political Outlook for Stimulus is Darkening, February 28, 2017

This is an excerpt from today’s Sevens Report. The Sevens Report is the daily market cheat sheet our subscribers use to keep up on markets, seize opportunities, avoid risks and get more assets. Sign up for a free 2 week trial.

It’s obviously impossible to say “when” this will matter to stocks, but I want to make very clear to everyone that the political outlook for stimulus is darkening, and the chance of any pro-growth measures hitting the markets in 2017 are falling, quickly… and sooner or later that will be a problem for this market.

To that point, yesterday there were three separate areas where the outlook for fiscal stimulus darkened. First, while Treasury Secretary Mnuchin did a good job in both his major interviews (WSJ and CNBC) he didn’t add anything incremental regarding corporate tax cuts, and was downright vague on the idea of border adjustments, which is the key to corporate tax cuts.

Yes, he did say he expects a broad corporate tax reform bill by the August recess, but that’s just repeating what Speaker Ryan has said (i.e., nothing new). Bottom line, the outlook for corporate tax cuts in 2017 (and maybe at all) continues to get worse.

Paul Ryan

Speaker Paul Ryan has said he expects a broad corporate tax reform bill by the August recess. The outlook for corporate tax cuts in 2017 continues to get worse.

There were some additional headlines regarding this issue late yesterday afternoon when President Trump told Reuters he supported “some form of border tax.” Markets initially took this as a positive (implying he was supportive of border adjustments) but that’s premature because what he meant was unclear as his subsequent comments more implied he supported tariffs in some form (not the full scale border adjustments needed to pass corporate tax reform).

Beyond Trump’s comments, the major hurdle for border adjustments and corporate tax reform remains in the Senate. There is little support for that idea in the Senate currently, and until that chances, corporate tax reform is unlikely.

Second, Axios reported that Trump is punting infrastructure spending to 2018. That was treated as a notable headline yesterday, but we and others have been saying for weeks now that infrastructure spending never was on the table for 2017. So, while this isn’t an incremental negative for the market, it was a headline that we wanted to cover.

Third, as we’ve covered, the way things are looking right now Republicans must get the repeal/replace of Obamacare done before they can tackle corporate tax reform. Well, Politico reported that Republican Alaska Senator Murkowski won’t vote for any repeal/replace that reduces the Medicaid expansion. With just a 53/47 majority in the Senate, the chances of just getting 50 votes on a repeal/replace continue to dwindle, and by all reports Republicans remain fractured on how to handle the repeal/replace.

Now, I’m not pointing this out for political reason (you know I’m politically agnostic in this Report). The reason I am pointing it out is simple: No Obamacare repeal/replace, then no corporate tax cuts in 2017, and that’s a problem for stocks (how much of a problem will depend on economic growth, inflation and interest rates, but it’s still a problem).

Bottom line, I don’t want to sound like the boy who cried wolf, but I just want to point out consistently and clearly that the gap between market policy expectations and policy reality is widening—and again, that’s a risk that should not be ignored.

This is a volatile, politically sensitive investment landscape—you need the Sevens Report to stay ahead of the changes, and to calm worried clients.

The FOMC Expects a Rate Hike “Fairly Soon” – Here’s What We Think That Means. February 27, 2017.

This is an excerpt from today’s Sevens Report. You can get a free 2-week trial and see for yourself how the Sevens Report can give you fresh talking points for your client conversations, and help you outperform your peers. Read on to see our predictions for when the FOMC will announce the next rate hike.

There were only two notable economic events last week and neither were particularly positive for stocks (although they weren’t outright negatives). For weeks, the economic data has been supporting markets through consistent policy disappointment from Washington, so it’s notable that last week the data wasn’t particularly supportive, and incremental disappointment finally weighed slightly on stocks. Going forward, with policy outlook continuing to dim, data will need to be consistently good to further support this rally.

Last Week

Looking at last week’s data, the February flash PMIs (both manufacturing and service sector) were surprisingly disappointing. The flash manufacturing PMI declined to 54.3 vs. (E) 55.5, which was a surprise miss given the very strong Empire and Philly surveys from two weeks ago. The flash services PMI also missed estimates at 53.9 vs. (E) 55.9, again posting a surprise decline. Additionally, most of the details in these reports, including New Orders in the manufacturing PMI (which is a leading indicator), also fell. Meanwhile, the manufacturing input price index rose slightly while the selling price index declined slightly, implying margin compression in the manufacturing sector.

Now, to be fair, the absolute levels of these two PMIs remain high and by no means does the mild pullback imply a loss of economic momentum. However, the market needs consistently better data to offset the noise from Washington, and that didn’t happen last week.

The FOMC expects another rate hike "fairly soon," but it is unlikely to be in March 2017.

The FOMC expects another rate hike “fairly soon,” but it is unlikely to be next month.

The FOMC minutes were the other notable economic event last week, and while the minutes were taken as slightly dovish by the currency and bond markets, in reality they only confirmed that May is now (in our opinion) the next likely date for a rate hike.

The key phrase in the minutes was the FOMC expected another rate hike “fairly soon.” The reason that was taken as slightly dovish is because fairly soon isn’t the “next meeting” (that’s what has appeared in the FOMC minutes before the previous two rate hikes). The takeaway is that a March hike is unlikely, though that’s not incrementally dovish because the market wasn’t expecting a March rate hike anyway. If we get a strong inflation number this week and a strong jobs report Friday, odds of a March rate hike could creep closer to 50% from the current 22% (and that could be a headwind on stocks).

This Week

This will be a busy and important week for the economy as we get some critical data on growth and inflation, and if stocks can maintain this rally, the former needs to be strong and the latter doesn’t. The most important number this week is the PCE Price Index contained in Wednesday’s Personal Income and Outlays report. February CPI and PPI were both much stronger than expected, and if the Core PCE Price Index (which is the Fed’s preferred measure of inflation) moves close to 2% (currently at 1.6%) then we will see expectations for a March rate hike increase, and that will send Treasury yields higher and send the dollar higher—and that will put a headwind on stocks.

The next most important number this week is the ISM Manufacturing PMI, out Wednesday. Normally, this would be the most important number of the week, but even if this confirms last week’s flash PMI and pulls back a bit from January, it’s still a very high absolute level and it will take several months of declines before anyone would get worried about activity in the manufacturing sector. Nonetheless, it is still a critical number and if it’s soft we could see a bit of stock weakness.

There are other notable reports this week including Durable Goods (today) and the services PMI (Friday). Finally, revised Q4 GDP comes Tuesday, and analysts are still looking for around 2% growth (Q4 GDP was 1.9% in the advanced look last month). As we said, all the data is important given strong data has helped offset growing policy worries, so these number meeting or beating estimates will be generally supportive. Bottom line, data needs to stay good and inflation needs to stay tame in order to support this market, because Washington policy expectations are a growing headwind.

Join hundreds of advisors from huge brokerage firms like Morgan Stanley, Merrill Lynch, Wells Fargo Advisors, Raymond James and more… see if the Sevens Report is right for you with a free 2 week trial.

Disappointing Numbers from Flash February Manufacturing & Service PMIs: February 22, 2017

Below is an excerpt from the “Economics” section of the Sevens Report. The Sevens Report has everything you need to know about the markets by 7am each morning in 7 minutes or less—can get a free trial if you sign up now.

Flash February Manufacturing & Service PMIs

  • Feb. Manufacturing PMI declined to 54.3 vs. (E) 55.5.
  • Fed. Service PMI declined to 53.9 vs. (E) 55.9.

Takeaway

In what was a surprising contradiction to last week’s very strong Empire and Philly manufacturing PMIs, both flash PMIs declined, and implied increased stagflation risk, signaling that further economic acceleration is not a foregone conclusion.

Now, to be clear, neither number was outright bad in an absolute sense. Both numbers in aggregate are reflective of a decently strong economy. Yet in order to power stocks higher in the context of growing political dysfunction, data needs to continue to show acceleration, and neither of these flash PMIs showed acceleration.

Declines in Nearly Every Sub Index of the PMI

Looking specifically at the manufacturing PMI, New Orders, the leading indicator in the Report, dipped to 56.2 from 57.4 (still a very high absolute reading but a decline nonetheless). In fact, virtually every sub index declined in February except for input prices, which rose slightly to 56.1 from 56.0. Notably, output prices (i.e. selling prices) dipped slightly to 51.7 vs. 51.9, which is indicative of margin compression. One number doesn’t make a trend, but that’s something to keep an eye on.

Bottom line, the flash PMIs are one of the bigger economic numbers each month, and this was a surprising disappointment. It won’t change the trajectory of the rally near term, but strong (and stronger) economic data is a critical support to this market, especially in the face of growing doubts in Washington. So, the rest of February’s data just got a lot more interesting.

Get the simple talking points you need to impress clients and prospects. Sign up for your free trial today: The Sevens Report.

Economics: This Week and Last Week. February 21, 2017

An excerpt from today’s Sevens Report. Subscribe now to get the full report in your inbox before 7am each morning.

Both economic growth and inflation accelerated according to last week’s data, and while the former continues to help support stocks despite a darkening outlook from Washington, the latter also is increasing the likelihood of a more hawkish-than-expected Fed in 2017, and a resumption of the uptrend in interest rates. For now, though, the benefit of the former is outweighing the risk of the latter.

If, however, we do not see any dip in the data between now and early May, I do expect the Fed to hike rates at that May meeting, which would be a marginal hawkish surprise. To boot, if we get a strong Jobs report (out Friday, March 3), then a March rate hike two weeks later isn’t out of the question. Point being, upward pressure is building on interest rates again.

Last Week

Both economic growth and inflation accelerated according to last week’s data.

Looking at last week’s data, it was almost universally strong. Retail Sales, which was the key number last week, handily beat expectations as the headline rose 0.4% vs. (E) 0.1% while the more important “Control” retail sales (which is the best measure of discretionary consumer spending) rose 0.4% vs. (E) 0.3%. Additionally, there were positive revisions to the December data, and clearly the US consumer continues to spend (which is more directly positive for the credit card companies).

Additionally, the first look at February manufacturing data was very strong. Empire Manufacturing beat estimates, rising to 18.7 vs. (E) 7.5, a 2-1/2 year high. However, it was outdone by Philly Fed, which surged to 43.3 vs. (E) 19.3, the highest reading since 1983! Both regional manufacturing surveys are volatile, but clearly they show an uptick in activity, which everyone now expects to be reflected in the national flash PMI.

Even housing data was decent as Housing Starts beat estimates on the headline, while the more important single family starts (the better gauge of the residential real estate market) rose 1.9%. Single family permits, a leading indicator for single family starts, did dip by 2.7%, but even so the important takeaway from this data is that so far, higher interest rates don’t appear to be negatively impacting the residential housing market, and a stable housing market is a key, but underappreciated, ingredient to economic acceleration.

Finally, looking at the Fed, Yellen’s commentary was marginally hawkish, as she was upbeat on the economy, basically saying the nation had achieved full employment and was closing on 2% inflation, and reiterated that a rate hike should be considered at upcoming meetings. None of her comments were new, but the reiteration of them reminds us that the Fed is in a hiking cycle, and the risk is for more hikes… not less.

This Week

The big number this week is the February global flash manufacturing PMI, out Tuesday. With last week’s strong Empire and Philly Surveys, expectations will be pretty elevated for the flash manufacturing PMI, so there is some risk of mild disappointment. On the flip side, if this number is very strong (like Empire and Philly) you will likely see a hawkish reaction out of the markets (dollar/bond yields up) and the expectation for a rate hike before June increases. That, by itself, shouldn’t cause a pullback in stocks, but upward pressure will build on interest rates.

Outside of the flash manufacturing PMIs, the FOMC minutes from the January meeting will be released Wednesday, and investors will parse the comments for any clues as to the likelihood of a March increase. Yet given the amount of political/fiscal uncertainty, and considering the FOMC meeting was before the strong January jobs report and recent acceleration in data, I’d be surprised if the minutes are very hawkish (although given they are dated, I don’t think that not-dovish minutes reduces the chances of a May or even March hike).

Bottom line, the focus will be on the flash manufacturing PMIs, and a good number this week will be supportive for stocks.

Join hundreds of advisors from huge brokerage firms like Morgan Stanley, Merrill Lynch, Wells Fargo Advisors, Raymond James and more… see if the Sevens Report is right for you.

What impact are Trump’s headlines having on markets?

Trump makes a lot of headlines, but what actually impacts the market?

After impacting the markets with his comment about a forthcoming “phenomenal” tax plan, the markets have been surprisingly unmoved by any of the headlines coming in from Washington D.C.

This week, we’ve seen stocks focusing on the good economic data (retail sales, Empire Manufacturing) and ignoring the political drama (Trump’s Labor Secretary nominee, Andrew Puzder, withdrew yesterday). Earlier this week, the market also remained steady after the news of National Security Administration Michael Flynn’s resignation.

What might Trump do to impact the market? After campaigning with somewhat hostile trade rhetoric, we’ve the realities of global trade soften his tone a bit. For example, he embraced the “One China” policy of governance over Taiwan. Similarly, so far Trump has resisted instructing the Treasury Department to label China a “currency manipulator” in its semi-annual currency report, due out in late March/early April. That would obviously be bad for stocks.

Find out first and keep your clients and prospects in the know. Sign up for your free trial of the Sevens Report and you’ll get all the market analysis in your inbox by 7am each morning. www.7sReport.com


How Big a Risk is a Trade or Military Dispute? February 16, 2017

An excerpt from the Sevens Report. Sign up for a two-week free trial of the full report at www.7sReport.com.

Earlier this week I began profiling non-political risks to explore when making decisions for your clients and talking with prospects. Here’s number three:

Non-Political Risk #3: Surprise Trade or Military Dispute

Surprisingly, and potentially dangerously, the market has fully embraced Trump’s pro-growth “big three” of tax cuts, infrastructure spending, and deregulation while totally ignoring the hostile trade (and to a lesser degree) military rhetoric—and that selective focus has helped fuel this rally in stocks.

How big a risk is a trade conflict with China?

Part of the reason investors have somewhat ignored the rhetoric is because they assumed that once Trump got into power, the realities of global trade would soften his tone. To a point, that has happened. Last week, Trump embraced the “One China” policy of governance over Taiwan. And, this past weekend visit with Japanese PM Abe came and went with no explicit mention of currency manipulation or unfair trade. But, while those are positives it’d be foolish to think there isn’t a real risk of a trade dispute/war with China.

Originally, the fear was that Trump would instruct the Treasury Department to label China a “currency manipulator” in its semi-annual currency report, due out in late March/early April. That would likely ignite some sort of a trade war as it would place automatic tariffs on Chinese goods. Obviously, that wouldn’t be good for stocks.

Trump appears to have backed away from such a direct confrontation, but as a WSJ article detailed, the administration is looking for a less “in your face” way to punish China for its trade practices (you can read the article if you’re really interested) but basically the strategy is to label currency manipulation an “unfair subsidy,” not just by the Chinese, but by every country. If that’s done, then individual US companies can lobby the Commerce Department to impose du-ties on competitive goods from countries they believe use currency manipulation. It’s basically a less-direct way to put duties/tariffs on Chinese goods.

Here’s the problem: Other countries can retaliate and do the same thing to the US, and cite the Fed’s ultra-low rates as manipulating the US dollar lower.

This will obviously be a fluid situation, but with Peter Navarro as the head of the National Trade Council (remember he wrote the book, Death by China) it’s un-likely that we won’t at least have a trade scare this year with China.

Looking militarily, the only real area of concern right now (well, there are multiple areas of concern, but the most pressing one) is the growing conflict between the US and China regarding their bases in the South China Sea. Trump advisor Bannon is particularly focused on this issue, and military officials have flat-out said that China won’t be allowed to operate a functioning naval or air base on these manufactured islands. Again, this is a low-probability event, but it remains a possibility.

Probability of a disruptive trade war? <30%. While the possibility is there, I’d expect marginal moves to try and correct trade imbalances with China, not all out tariffs or import duties (although I’m sure they will be publicly threatened, which will be negative for sentiment).

“Leading Indicators” and, “How do we position if it happens?” sections are restricted to subscribers.

Take advantage of the limited time special offer—if you subscribe to the Sevens Report today, and after the first two weeks you are not completely satisfied, we will refund your first quarterly payment, in full, no questions asked.

Copyright 2017, Kinsale Trading LLC. All Rights Reserved. www.sevensreport.com

Economic Growth Slows: February 14, 2017

An excerpt from today’s Sevens Report.

Non-Political Risk #1: Economic Growth Slows.

Stronger economic data remains an unsung hero of this post-election rally, and while Trump gets the headlines, it’s really the economic data that’s enabling this rally as better economic growth is allowing the market to continue to give Trump and the Republicans the benefit of the doubt.

I can go through the litany of reports, but whether it’s PMIs, the Jobs Report, or Business Investment, the data has been accelerating since mid to late 2016, and that’s created the proverbial “rising tide” that’s helped under-write both policy optimism and the rally in stocks.

But, while hope may be growing that there will be less drama from the administration (the reason for Monday’s rally), at the same time there’s growing evidence that actual policy reality will not meet market expectations.

So, in the near term, it’s going to be up to economic data to continue to provide a reason for markets to give Washington the benefit of the doubt, otherwise the sober reality of a market that now trades well over 18X current-year earnings will begin to cause problems.

Bottom line, if economic growth slows in the near term, that will cause a pullback in stocks. So, in today’s Sevens Report for subscribers, I go into detail on: 1) How likely is an economic slow down? 2) What are the leading indicators to watch? and, 3) How do we position if it happens?

First, how likely is an economic slow down? > 50%.

A probability that high may surprise people, but I have several reasons for it: First, we’ve seen an acceleration in economic activity, but we still haven’t really achieved the “breakout” pace of consistent 3% GDP growth that tends to feed on itself and further stimulate the economy. For all the excitement, we’re still in a 2%ish GDP regime (GDP Now from the Atlanta Fed has Q1 GDP at 2.7% in Q1). Point being, things down have to slow very much before the economy is right back in neutral.

Second, the consumer has powered this economic acceleration, but the consumer is tired. Credit creation is slowing, and retail sales reports have been lackluster of late. To boot, the job market remains basically at full employment and while wages are rising, they aren’t rising fast enough to power incremental acceleration consumer spending. Unless we see proof consumers are accessing the equity in their homes, I don’t see what will cause consumer spending to grind higher.

The Citi Economic Surprise Index rose steadily through Q4 of 2016 as economic data consistently beat expectations. Going forward, this index is now an important leading indicator for the market, as any material move back down towards zero will create a headwind on stocks.

Third, business investment has accelerated lately and that is good, but the uncertainty over the tax code changes (and trade in general) has the potential to be-come a headwind on business investment. Here’s my point: The tax changes being discussed in Congress could eliminate interest deductibility and change a host of other tax issues. If I’m a business and I’m thinking of getting a big loan to finance expansion, I’m likely going to wait until there’s more clarity on these and trade issues be-fore taking on too much risk.

Finally, leading indicator of growth for the global economy, China, is actively trying to slow its economy. China’s credit-fueled expansion back in February 2016 marked an inflection point in the global economy and things have been better since. But with a year of stimulus be-hind it, currency issues, and once again overheating property and asset markets, Chinese authorities are trying to cool their economy. The effects aren’t immediate or direct on the US economy, but the fact is that a slow-ing Chinese economy will become a headwind on the US at some point (how much of a headwind depends on how well the cooling is managed).

“Leading Indicators” and, “How do we position if it happens?” sections are restricted to subscribers.

Take advantage of the limited time special offer—if you subscribe to the Sevens Report today, and after the first two weeks you are not completely satisfied, we will refund your first quarterly payment, in full, no questions asked.

Copyright 2017, Kinsale Trading LLC. All Rights Reserved. www.sevensreport.com

Economic Cheat Sheet: February 13, 2017

Last Week:

There was very little incremental economic data last week, and what reports did come met expectations and importantly did nothing to change the perception that economic activity is legitimately accelerating—a perception that continues to support stocks broadly.

From a domestic data viewpoint, there isn’t a lot to talk about. Jobless claims continued to fall and hit another multi-decade low (a 43-year low), and that’s even more impressive when you consider how much the population has grown since then. Internationally, there was mixed data from China as their foreign exchange reserves dropped below the psychologically important $3 trillion level. While that was ignored by markets this week, China continues to bubble as a potential macro surprise in Q1/early Q2. These foreign currency reserves are a story we need to continue to watch.

But, January Trade Balance was much stronger than expected (exports up 7.9% vs. (E) 3.1%), and that data point early Friday helped alleviate some concern. Still, China’s currency reserves are declining, and authorities are actively trying to pull leverage from their economy and cool growth. More often than not, that leads to some sort of macro-economic growth scare—so just a heads up for the coming months.

Bottom line, economic growth remains an important pillar of this rally, and nothing last week changed that set up, which again was why at worst stocks were flat before the political headlines caused the late-week rally.

This Week:

As we’ve said, two of the biggest risks to the rally outside of Washington remain 1) Lackluster data and 2) A more hawkish Fed. Given those risks, the growth and inflation data this week is important.

Janet Yellen (AP Photo/Jacquelyn Martin)

However, the most important event of the week will be Fed Chair Yellen’s semi-annual Humphrey-Hawkins testimony to Congress, on Tuesday (the Senate) and Wednesday (the House). While she isn’t going to telegraph when the Fed will raise rates, her comments are still important considering the market remains complacent with regards to a Fed rate hike. There is no expectation of a March or May hike, and we continue to think the market is a little too complacent with regards to the potential for a May hike (we admit March seems remote).

Staying on the theme of Fed expectations, the next most important number this week is the January CPI report out Tuesday. The Fed does not believe inflation is accelerating meaningfully (due to the data), but if inflation does pick up pace that will be hawkish and will send yields higher—and most likely stocks lower.

Looking at growth data, Wednesday and Thursday are the key days to watch as we get January Retail Sales (Wed), Empire Manufacturing (Wed), January Industrial Production (Wed) and Feb. Philly Fed (Thursday). Of those four reports, the retail sales number is the most important, because consumer spending has been the engine of growth for the US economy, and it needs to maintain a decent pace because while business investment has picked up, it won’t offset a continued moderation in consumer spending.

The Empire and Philly Fed Indices are the next most important numbers next week, as they will give us the first look at February activity. Since better growth is a key support to this rally, they need to show continued strength. Neither number needs to accelerate meaningfully, but we can’t see much of a retracement, either. Bottom line, strong economic data and benign inflation data (Goldilocks numbers) have been an important support for this market as Washington reverts to the mean (gets more dysfunctional), and that needs to continue if stocks can hold recent gains in the face of confusing political headlines.

Get full Sevens Report delivered to your inbox each morning before 7:00am: http://www.7sreport.com/