Stock Market Update: 7/11/2016

stock-market-3

Stocks surged last week thanks almost entirely to the post-jobs-report Friday rally. The S&P 500 rose 1.28% on the week, and is up 4.21% year to date, and now is within a few points of its all-time high.

Despite the gains, the week started with some volatility as the S&P 500 dropped 1% Tuesday following a plunge in European financials stemming from worries about Italian banks and fund redemption halts at British commercial property funds. But, the market acted resilient and stocks rallied during the final hour of trading to close the day down modestly.

A good June ISM Non-Manufacturing PMI helped stocks rally Tuesday as markets ignored more weakness in European bank stocks (an important European bank index broke to multi-year lows), and the S&P 500 rallied and recouped almost all of the Tuesday declines. Thursday stocks basically drifted sideways ahead of the jobs report, as a drop in oil to one-month lows helped offset more positive economic data (good jobless claims) and a good earnings report from PEP.

Then, stocks exploded higher Friday as the blowout jobs report combined with a lack of selling in bonds and no rally in the dollar created a short squeeze higher that built on itself throughout the trading day amidst low volumes. Stocks moved steadily higher throughout the morning and afternoon, and traded to multi-month highs, closing just below the all-time high.

Trading Color

Cyclical sectors outperformed last week, but that was due almost entirely to Friday’s big rally, which came on low volumes and consisted of faster money managers chasing stocks higher via higher-beta cyclicals. Not to pooh-pooh the rally, but it didn’t come on strong volumes or with a lot of conviction.

From an internals standpoint, easily the biggest question facing advisors and investors over the next few weeks will be whether we see a large rotation out of defensive/yield-oriented sectors (utilities, staples, REITs) and into cyclicals (banks, materials, consumer discretionary). There certainly was some of that on Friday as cyclical sectors did outperform, but it was not nearly as big as it could have been given how “overbought” most people think utilities/staples and REITs currently are.

In fact, we were actually relatively impressed with the performance of consumer staples (XLP/FXG) on Friday, as given their recent outperformance we could have easily seen outright declines in both those sectors following that strong jobs report. To that point, there will be a lot written about a potential massive rotation out of defensive sectors and into growth over the coming weeks, but until we see a material break lower in the belly and long-end of the Treasury curve, the income provided by staples, utilities, REITs and other defensive sectors will remain critical to outperforming in a choppy market.

On the charts, the S&P 500 broke through several levels of resistance and nearly notched a new intra-day high—2134 is now the next near-term resistance level while support sits lower at 2100.

Bottom Line

Two and a half weeks ago the S&P 500 plunged temporarily below 2000 on Brexit fears, but in less than three weeks the market totally recouped those losses and traded to near-18-month highs. Yet despite all this whipsaw activity, the outlook for stocks has remained largely unchanged, and the bull and bear arguments remarkably static.

So, despite the rising chorus of optimism (which is largely based on very resilient price action) we remain generally cautious on stocks as fundamentals have not materially improved, and because of that we would not be chasing markets at these levels and would resist adding significant capital into stocks broadly, or re-adjusting allocations into higher-growth/cyclical sectors.

Looking at the bull’s argument, it has been bolstered by strong data so far in June, but with unknown Brexit effects looming, any well-reasoned bull is still solely relying on the $130 2017 S&P 500 EPS to justify allocating new capital to stocks. That’s the same argument we’ve had since April. And, in the meantime, the dollar is higher (which will weigh on earnings in the coming quarters) and oil looks heavy. To boot, if the bulls are right and we see a 17X $130 number, that’s only 2210 on the S&P 500, which is less than 4% from current levels. 2000 (which we hit less than three weeks ago) is now about 6% from current levels, so the risk/reward is not attractive.

Now, to be clear, I’m not advocating shorting stocks or selling everything. This tape is strong and that must be respected. But, from a “what do we do now” allocation standpoint, we are staying relatively unchanged in our proprietary accounts. We are not materially adding more cash to stocks, nor are we rotating out of defensive sectors and into cyclicals like materials or consumer discretionary.

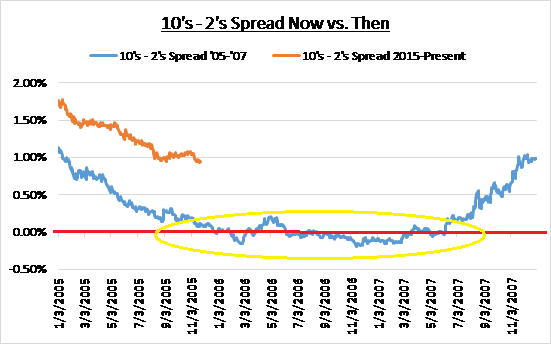
Looking at other assets, the markets continue to send “Caution” signals. Treasury yields remain near all-time lows, the pound remains weak and Brexit is not “over” as an influence, the 10’s-2’s Treasury yield spread hit greater than 10-year lows last week while gold remains elevated and European (especially Italian) banks remain under pressure. Again, the odd man out in this cross asset analysis is US stocks, which are just off all time highs, so either the US stock market is “right” and everything else is wrong, or stocks are simply pricing in a very optimistic scenario right now. Regardless, despite the optimism we remain cautious.


Boring But Important: Italian Banks

Since the Brexit vote we’ve been focused on watching European banks, as they will tell us when potential anti-EU political contagion morphs into actual financial contagion (which would be a bearish game changer). And while far from an “all clear,” there have been a few positives for European banks last week.

First, the SX7P, the STOXX Bank Index, has held that 117.53 low last Thursday, which is a general positive. Second, as mentioned, there was a quietly important article from the WSJ that detailed how the European Commibankitallyssion is allowing the Italian government to support any troubled Italian banks, if help is needed.

Generally speaking, in the short term at least, that is a positive as Italian banks are generally considered some of the weakest in all of Europe, with badly performing loans, terrible margins and weak balance sheets. So, this authority helped reduce the chances of an immediate issue.

However, at the same time, I do find it disconcerting this had to be done. First, it’s a bit of a validation of fears about how weak Italian banks have become. Second, Spanish and Portuguese banks are not much better than Italian banks (from a strength standpoint) so in some ways this raises concerns about them as well. Finally, unlike in the US, a European country being able to guarantee banks is not always a panacea.

Remember, the Irish government was bankrupted (basically) because they guaranteed bad Irish banks, whose liabilities exceeded the government’s assets! That’s why Ireland needed a bailout.

I’m not saying the same thing will happen in Italy, and we’re a long way from that point, but when governments who can’t print their own money start guaranteeing banks, I’m afraid I get a touch nervous.

So, bottom line, we saw a short-term step forward, but it doesn’t make me any less nervous about European banks more generally.

Bottom line, sentiment is better and that’s positive, but European banks remain “Ground Zero” for any signs of contagion from Brexit, and we’ll continue to watch SX7P closely.

How Brexit Will Move Markets (Stocks, Bonds & the Dollar)


brexit-800x500

Many subscribers to the Sevens Report have been asking:

  • What Will Make Brexit Good, Bad and Ugly
  • Why a “Remain” Vote May Not Be A Positive for Stocks
  • How Stocks, Bonds and the Dollar Will React Depending on the Vote
  • How to Protect Portfolios and Seize Opportunities Regardless of the Outcome.

Brexit Preview: Good, Bad & Ugly

First, let me start by saying that any remain win will result in a relief rally, one that likely will take European stocks through the pre-Brexit highs of late May, and the S&P 500 through 2,100 to test recent resistance at 2,120. But for Brexit to become a material positive (and in that regard be totally removed as a macro headwind), style points will matter with regards to “by how much” the remain camp wins.

Conversely, the size of a leave victory is unimportant.  Whether Great Britain votes to leave by a one-vote majority or a 10% majority, the result in markets will be the same—pain!


The Good: Remain Wins by > 10%. This is the best outcome for the bulls. The reason for that is because a greater-than-10% victory likely means that, at least for the foreseeable future, the idea of Brexit politically will be dead—and that means we don’t have to worry about another vote in the future.

Likely Market Outcome: Risk On. Stocks: Sharply higher and led by Europe, although the US will be up big also. Resistance at 2,120 will likely be tested in the S&P 500. Sector Winners: Anything with UK or European exposure will outperform (and the more the better, HEDJ and VGK are obvious winners), US global industrials like GE/HON will also benefit from the reduced international uncertainty. Financials (XLF), banks (KBE) and basic materials also will outperform (thanks to a weaker dollar and rising bond yields). Bonds: Treasuries and bunds will drop (likely sharply) and yields will rise (likely sharply). Commodities and Currencies: Gold will drop (support at $1,250 will be important) while industrial commodities will rally (oil, copper, etc.). The dollar and yen will get hit, likely hard, and support at 93.50 in the dollar will likely be broken on a short-term basis, but as long as there isn’t a close below 92.52 it’s not too bearish. Finally, the pound and euro will surge short term (although we don’t see this outcome as starting a new material move lower in the dollar or move higher in European currencies beyond the short term).


The “Bad”: Remain Wins By <10%. I put “bad” in quotation marks because risk assets will still rally on this outcome, but the market reaction should be substantially muted compared to the “Good” scenario. Here’s why.

If remain wins by a slim margin, we will likely have another Brexit vote, potentially in late 2016 or early 2017.  The reason for that is politics: If the remain win is tight, the ruling Conservative party’s mandate will be called into question and a general election will likely be called later this year. The minority parties (Labour and others) will use another potential Brexit vote as a carrot to try and seize power in that general election.

Bottom line, if this victory is slim, Brexit will be put on the back burner from a macro risk standpoint, but it won’t be removed.

Likely Market Reaction: Basically a scaled-down version of the “Good” outcome, with moves in the same direction, just in smaller percentages.

The Ugly: Leave Wins. If leave wins by just a single vote it will be a material negative for Europe and Great Britain (at least for the short and medium term).

Likely Market Reaction: Risk Off. Stocks: Europe would drop like a stone (3%-5% is not out of the question). US stocks would also drop (2,050 would be important support for the S&P 500). Sector losers: Banks, financials, global industrials and basic materials will drop sharply. Bonds: Treasuries and bunds would surge, and I would expect the respective low yields for the year in each to be taken out on a leave outcome. Commodities and Currencies: It would be typical risk-off trading: The dollar and yen will surge, the euro and pound (and to a lessor extend commodity currencies) will drop sharply. In the dollar, resistance at 95.50 and 95.90 would likely be tested in the coming days. Looking at commodities, gold would rally big (another break of $1,300 would be likely) while oil and copper would drop sharply.

Bottom Line

From an opportunity standpoint, I’ve never been a fan of guessing binary events with which I have no special insight or edge, so tomorrow we will not be positioning ahead of the result Thursday night. I will leave that adventure to those much smarter and more intrepid than I.

But, from a broad, macro-allocation standpoint, unless we get a shock and leave wins, this won’t change my opinion on US stocks broadly. I have looked at Brexit largely as a mid-summer distraction, and I hope to be proven right on that by this time tomorrow. Beyond potentially creating a buying opportunity for HEDJ (as we mentioned last week) or a Great Britain ETF, the only other likely legitimate market reaction from this will be a move lower in Treasuries and bunds (i.e. higher yields).

To that point, if remain wins and we do not see a material move in Treasury and bund yields over the coming week or two, I will take that as a big negative signal on the economy and markets—because absent Brexit protection buying, those yields should be substantially higher than they are, if we are to believe the economic data.

And while the S&P 500 will likely surge on a remain victory, nothing about it will make us more inclined to get bullish on stocks, because the issues of 1) valuation, 2) lackluster economic growth, 3) troubling profit margin trends in corporate America and 4) lack of Fed clarity will “remain” (pardon the pun).


Why the Yield Curve Matters to Your Clients

When you started in this business, did anyone sit you down and explain that watching things like the “10’s minus 2’s Spread” could help predict economic slowdowns and potentially avoid stock markets declines?

Me either.

I learned it the hard way – through being an execution trader and later a buy side portfolio manager through the mid – 2000’s, when in hindsight an inverted 10’s minus 2’s Spread provided a massive warning that a calamity was looming (the financial crisis).

Perhaps it’s just because of the scars from that period, but if you’re like me your blood pressure still goes up every time you hear “best” or “worst” since ‘07/’08.

So, my blood pressure is up considering I’ve heard it twice in the last week:

  • Yesterday, the New Home Sales report posted the best number since January ’08.
  • Last week, as we and others pointed out, the 10’s minus 2’s Spread fell to its lowest level since last ’07.

Our primary mandate here at The Sevens Report is to make sure our subscribers never get blindsided by a macro-economic event, so that second statement concerns me a lot more than the first excites me, at least from a portfolio management standpoint.

We alerted subscribers to the 10’s – 2’s spread dropping to near 9 year lows last Monday (two full days ahead of the WSJ), and you, via these free excerpts Wednesday.

And, over the past week, I’ve had several discussions about the curve with colleagues, some of whom agreed with me about my concern, and some of whom tried to convince me that it is indeed different this time and the flattening curve is not a problem.

Yield curve dynamics are not in advisor trading programs, and the media doesn’t make it clear why the curve is important. So, I want to cover that quickly:

Myself and others watch the yield curve because it’s generally speaking a good, broad predictor of future economic activity. And, below I explain what the shifting yield curve says about future economic growth.

We watch all markets (including the bond market and the yield curve) so we can alert subscribers to the rising chance of a pullback before it happens.

That’s why we produce this Report at 7 AM every trading day, so that our paid subscribers are never blindsidedby a macro-economic surprise.

To that point, stocks are strong again today but there isn’t a real “reason” for this two-day rally, and it reeks of short covering and chasing, just like the previous failed rallies of the last three weeks.

Meanwhile, looking at fundamentals, the macro horizon is again filling with potential bearish influences:

  • Chinese economic data missed estimates in April and worries about the Chinese recovery are rising.
  • Complacency towards the Fed is as high as I’ve ever seen as markets simply do not believe anything the Fed says with regard to rate hikes, and that means another “Taper Tantrum” is possible between now and July (chances of a June rate hike are just 38%).
  • Politics will once again become a force on the markets as the Brexit vote nears and the US Presidential Election gets closer.
  • US economic growth needs to accelerate and while there’s not a risk of a recession, the first data points from May (Empire State Manufacturing, Philly Fed and Richmond Fed) started with a “thud.”

Bottom line, despite the S&P 500 again challenging 2100, I think the next two months will be more difficult than the last two months, and it will be harder for advisors to keep up on the shifting influences on this market.

That’s why we’re going to make sure we do that for our paid subscribers, because the most important thing for financial advisors to do for the rest of 2016 is show clients that they: 1) Know what is going on in markets, 2) Are in control of client portfolios, and 3) Know what to expect next.

Because if you don’t, you could lose those clients to someone who does.

We make sure our paid subscribers have an independent analyst team that communicates with them daily at 7 AM and quickly identifies the risks and opportunities for:

  • Stocks
  • Bonds
  • Currencies
  • Commodities, and
  • Interprets what economic data means for the market.

The Sevens Report is the daily market cheat sheet our paying subscribers use to keep up on markets, seize opportunities, avoid risks and get more assets.

With a monthly cost of less than one client lunch, we firmly believe we offer the best value in the independent research space.

Understanding the signals the bond market is sending is very important for anyone managing money for the longer term, so we wanted to directly explain what shifts in the yield curve mean for the economy and stocks.


Why The Yield Curve Matters to Your Clients

There are three movements the yield curve can make: Steepening, Flattening, and Inverting. Each gives a different implication for future economic growth:

A Steepening Yield Curve (where long-term yields rise more quickly than short-term yields) is generally representative of an economy that’s seeing growth accelerate. The reason (broadly speaking) is because in a good economy, capital tends to leave bonds and flow into more cyclical assets that offer more upside like stocks. So, investors sell longer-dated bonds because they don’t want to be stuck in a long-term, low-yielding asset compared to other alternatives. Put simply, people don’t want to settle for getting a low-but-stable yield.

A Flattening Yield Curve occurs when the bond market fears an economic slowdown, investors flood into bonds as protection, sending long-term bonds sharply higher and yields lower, which then flattens the yield curve (it’s the inverse of the previous scenario, as investors flock to the safety of stable-but-low yields).

An Inverted Yield Curve occurs when investors are becoming so concerned about future economic growth that they are piling into longer term Treasuries to guarantee a return of capital, not a return on capital, and the yield on the 10-year Treasury Drops below the yield on the 2-year Treasury.

So, as a guide:

Steepening Yield Curve: 10-year Yields Rise Faster than 2-Year Yields = Expected Economic Acceleration.

Flattening Yield Curve (which we’ve had recently): 10-year Yields Drop faster than 2-Year Yields = Looming Economic Slowdown.

Inverted Yield Curve: The 10-year yield is less than a 2-year yield = Looming Recession or worse.

The yield curve inverted during the ’06 – ’07 period and forecasted the looming financial crisis.

The yield curve is flattening substantially right now, despite the broad expectation of higher economic growth, and it’s making me and other analysts nervous about coming months and quarters.


chart1 5-25

Bottom line, the flattening yield curve had our attention because historically it signals an economic slowdown, and if there is a slowdown looming, than that’s obviously a big problem for stocks going forward.

 chart2 5-25

Finally, with regards to timing, when the yield curve inverted in 2006, it took a while for the stock market to break (again these are slower moving indicators), but advisors who ignored that warning and remained in “Risk On” mode enjoyed modest short term gains, but suffered massive losses in ‘08/’09.

Meanwhile, advisors with longer time frames, who heeded that warning sign, didn’t miss much upside, and likely avoided 60% drop in the S&P 500 in ‘08/’09.

That’s why we watch these indicators for our subscribers!


It’s Different This Time (2007 Edition).

Finally, in reference to, “It’s different this time,” (the idea that this flattening yield curve isn’t signaling a looming slowdown) I had to dust off some of my old notebooks, but just as a reference, when the yield curve last flattened and inverted in ’06/’07, everyone said, “It’s different this time.”

Back then, the reason cited was the massive global yen carry trade, where hedge funds were selling Japanese government bonds (which had a 0% yield) and taking that capital and dumping it into Treasuries, on a massively leveraged basis. That, theoretically, pushed down longer-dated Treasury yields in the midst of a mild Fed tightening cycle and that caused the yield curve to invert, (although it’s important to remember back then the 2-year yield was over 4%).

That was the reason it was different that time, but we all know that in the end, it wasn’t different at all (in hindsight, the yield curve was screaming an alarm bell well before the financial crisis).

I’m in no way saying we’re going to see a repeat of that this time, but I don’t believe it’s different this time, and if this yield curve continues to flatten I’ll take that as a continued warning sign.

Our paid subscribers know that they can rest easy because we are watching all asset classes for them, and we will alert them when one of them (like the yield curve) flashes “Caution” like it is now, and when that “Caution” becomes a “Warning.”

If your brokerage or paid research isn’t providing you this type of analysis on a daily basis, please consider a quarterly subscription to The Sevens Report. The monthly cost is less than one client lunch, there is no penalty to cancel, and our retention rate is over 90%.


Value Add Research That Can Help You Grow Your Business in 2016 (Despite the Tough Start)

Our subscribers have told us how our focus on medium term, tactical opportunities and risks has helped them outperform for clients and grow their books of business.

We continue to get strong feedback that our report is: Providing value, Helping our clients outperform markets, and Helping them build their business:

“Tom’s ability to summarize market action in minutes is invaluable in today’s environment of data overload. We spend over $100,000 a year on research, and The 7:00’s Report is the one piece of research I can’t do without. – John S., Vice President of a multi-billion-dollar asset management firm.

Great service from a great company!!” – FA from a National Brokerage Firm.

“Great report. You’ve become invaluable to me, thanks for everything…! – FA from a Boutique Investment Management Firm.


Best,
Tom
Tom Essaye,
Editor of The 7:00’s Report

Weekly Economic Cheat Sheet 12.28.15

Last Week

Data was sparse last week but the reports that did come were lack luster and while none of them are enough to increase concerns over the pace of the US economy, it is an undeniable point that data has underwhelmed lately, and that’s especially notable given the Fed just hiked rates.

The highlight last week was the Personal Income and Outlays Report (out last Wednesday), and the income and spending numbers largely met expectations, as did the really important metric in this report—Core PCE Price Index. The index rose 0.1% in November, meeting expectations while the year-over-year change remained unchanged at 1.3% (the same as October).

The Fed’s preferred measure of inflation once again didn’t follow November CPI higher, and between this and the durable goods number there was a slightly dovish takeaway from the data—although there’s so much time between now and the second hike (March at earliest, June most likely) that yesterday’s data won’t affect the decision in any way.

November Durable Goods was the next-most-important number last week, but it was by far the most disappointing. Headline durable goods were unchanged vs. (E ) -0.5%, but the beat was misleading. The flat monthly result was thanks to an uptick in defense spending, but the more important New Orders for “Non Defense Capital Goods Ex Aircraft” declined 0.4% in November, and the October gains were cut in half, from 1.3% to just 0.6%.

Business investment/spending was a bright spot in Q3, but it appears that is fading according to this latest report. This miss is another anecdotal negative in the manufacturing/capital goods segment of the economy. This likely will result in some small reduction of Q4 GDP estimates and reinforces the continued sluggishness in the broad manufacturing sector. This was not the number we would hope for following the first interest rate hike in nine years.

Finally, the November housing numbers continued to roll in last week and the results remain generally lackluster (meaning neither a headwind nor a tailwind on the broader economy).

The November Existing Home Sales number was a big miss vs. expectations (4.760M saar vs. (E) 5.320M saar) but the headline was misleading. In November the “Know Before You Owe” initiative began, which lengthens closing times for buyers. So, since Existing Home Sales are counted when the deal is closed, this caused an artificial delay that should be corrected in December.

Looking at some of the details, supply remains low at 2.04 million homes for sale vs. 2.11 million in October while prices remain firm (up 0.5% and 6.3% yoy). Price remains the key metric in this report, and overall it is healthy, so from an economic standpoint that’s mainly why these numbers aren’t a concern.

Bottom line, the details in the report imply the “real” Existing Home Sales number would have generally been “fine,” and while housing data lately has been a touch lackluster, the recovery remains firmly in place.

Again, bottom line, last week’s data wasn’t bad in an absolute sense and it certainly doesn’t imply the US economic recovery is losing momentum, but we would have liked to have seen better numbers given the Fed hiked rates two weeks ago. Again, data needs to turn better early in 2016, otherwise concerns about the pace of growth will start to rise.

This Week

This will be a very quiet week in the markets, given 1) The end of the year and 2) A very light economic calendar. There is virtually no foreign economic data throughout the week, and in the US there are only a few generally minor reports.

The most notable report will be the advanced Trade Balance out Tuesday, and that’s a bit more important than usual given the negative effect of the stronger US dollar on exports (and more broadly the manufacturing sector and corporate earnings). If exports are a big miss Tuesday morning that doesn’t bode well for manufacturing, so that’s why the market will care a bit more about this report than usual.

Looking past the trade balance there are two notable housing reports: Case-Shiller Home Price Index Tuesday and Pending Home Sales on Wednesday. As mentioned, price remains a critical factor in the housing market, so as long as Case-Shiller shows prices remain generally stable, then the outlook on housing won’t change. Pending Home Sales also remains important, but if it’s a “miss” for the right reasons—i.e., low supply—then that’s generally “ok” too, because the low supply will continue to support prices. Either way, unless one of these reports is a huge miss, the market should generally ignore them.

Bottom line, the advanced Trade Balance number is really the only potential wild card out there this week, and unless exports plunge it shouldn’t affect markets too much.


Weekly Economic Cheat Sheet 12.21.15

Last Week

Last week was historic as the Fed hiked rates for the first time in nearly a decade, but it wasn’t fully the “Dovish hike” investors were hoping for. So, between new uncertainty surrounding the path of future rate hikes and worsening manufacturing indices, the economic outlook for the market did not materially improve.

Starting with the Fed decision, for a two-hour period it looked like the Fed perfectly threaded the needle between hiking rates for the first time in nearly 10 years, and providing enough dovish guidance to comfort markets that the next rate hike won’t come for a long time.

Unfortunately, once investors looked past the dovish tone, they focused on what we were all focused on—the “dots.” The fact that the Fed didn’t reduce the median dots for 2016 (which shows where the Fed thinks the Fed Funds rate will be at year end) was taken as modestly “hawkish,” and that was largely responsible for the dollar surge Thursday and the plunge in stocks.

The main takeaway from the Fed hike is that there remains a large and substantial gap between where the FOMC thinks rates will end 2016 (at 1.375%) and where the market (via Fed Fund futures) thinks rates finish 2016 (0.875%). Bottom line, there is a two-meeting discrepancy and that needs to be resolved. Whether the Fed needs to get more hawkish or the economy prevents another timely hike, either scenario is at least a temporary headwind on stocks. Going forward, the proper framework to view what the next Fed rate hike means for stocks is this: June=“Good,” March=“Bad”, After June=“Ugly.”

Looking at the rest of the data from last week, the December manufacturing PMIs were disappointing, and disconcertingly imply we are not yet seeing stabilization in the manufacturing sector, which continues to be plagued by excess inventory and a strong dollar.

December flash manufacturing PMI missed estimates at 51.3 vs. (E) 52.8, as did December Philly Fed, which turned negative again. Empire Manufacturing Survey actually slightly beat estimates, but it remained in negative territory and New Orders in both Empire and Philly plunged (New Orders are the leading indicators in the manufacturing PMIs).

Bottom line, the recent manufacturing data does not imply stabilization, as we said last week. While soft manufacturing won’t derail the US economy, stable manufacturing is needed if the economy is ever going to achieve “escape velocity” of 3.5%-plus growth (and that matters because we need that for stocks to materially break out from current levels).

Bottom line, last week brought closure on the drama surrounding the first rate hike in nearly 10 years, but beyond that it didn’t provide a lot of additional clarity on the economy, so the economic outlook for the US remains unclear, despite the events of last week.

This Week

Even if Christmas wasn’t this week the economic calendar would be pretty light, but the holiday (1/2 day Thursday, off Friday) will make the data this week even less impactful. The only real, notable economic event this week comes Wednesday with the release of the November Personal Income and Outlays Report.

As you likely know by now, this report is important every month not because of the headline but instead because of the Core PCE Price Index contained in the report, which is the Fed’s preferred measure of inflation.

Inflation was highlighted by the Fed even more than normal in last week’s statement, so it’s not an oversimplification to say that what inflation does over the next two months will decide whether the Fed hikes in March (very unlikely given current inflation levels) or June.

Remember inflation pressures continue to firm (Core CPI last week rose 2.0% yoy) so if the Core PCE Price Index begins to reflect any upward pressure, that will be hawkish (and not good for stocks). It likely won’t happen this week, but following last week’s FOMC statement Core PCE Price Index is an even more important indicator to watch.

The other notable reports this week include Durable Goods, which has been strong lately and bodes well (potentially) for Q4 growth as business spending and investment has been a positive surprise economically.

There are also several more housing numbers (November Existing Home Sales on Tuesday and New Home Sales on Wednesday). These reports were disappointing in October and more soft numbers are expected given the decline in Pending Home Sales (which lead existing home sales), but as long as the disappointments are supply based (lack of homes for sale) and price is generally steady, they shouldn’t elicit too much of a reaction from markets.

Final Q3 GDP comes Tuesday, but at this point the data is so old it’s virtually inconsequential, while jobless claims finish the week on Thursday. Overall, it should be a quiet week barring any shocks from the Core PCE.


Weekly Economic Cheat Sheet 12.14.15

Other than the retail sales report out Friday, which was a strong report, there were virtually no notable economic releases last week. We exited last week much as we began, with bond markets signaling an 85% chance of a rate hike this week (which from a market standpoint is basically a sure thing). Looking at the one material report last week, Retail Sales was stronger than expected and again further confirmed that the US consumer remains healthy despite lingering concerns and retail stock underperformance. The important “control group,” which excludes gasoline, autos, building materials and food services, rose a substantial 0.60%.

This was an important report because it helps offset the apparent increased deceleration in US manufacturing. But, as we and other have said many times, it’s much, much more important for US consumer spending to be accelerating than it is manufacturing to be strong. Bottom line, it was the only notable report last week, but it’s an important one as the US consumer appears to be accelerating his/her spending.

This Week

Even if there wasn’t a potentially historic Fed meeting this week, it would still be a busy week from a data standpoint, so the Fed meeting Wednesday just adds to an already-stacked calendar.

Obviously the FOMC is the highlight of this week, and while it’s universally expected the Fed will raise rates 25 basis points, the bigger unknowns are 1) The language surrounding the next hike, 2) How the “dots” shift reflecting the expected number of hikes in 2016, and 3) Yellen’s tone in the press conference (which will likely be very dovish). We will do our typical “Good, Bad, Ugly” FOMC Preview tomorrow, but obviously this is the most important event of the week.

Beyond the Fed this week brings the latest look at both global and US manufacturing data. US and Global December flash manufacturing PMIs (excluding China) are released Wednesday morning, right before the Fed, and they are important because the November data showed a loss of positive momentum in the US and Europe. Those numbers need to firm up to help the markets broadly.

Given the December flash PMIs are released this week, they steal the thunder from Empire and Philly Fed Manufacturing Surveys (Tuesday/Thursday), which will give us an additional look at manufacturing activity in December (further improvement towards a less-negative reading will be welcomed by the market).

CPI will also be released Wednesday before the Fed, and although it’ll be important to see if it shows a further firming of inflation it’s not likely to sway the Fed one way or the other (remember the Fed prefers the PCE Price Index as it’s statistical measure of inflation). But, continued firming in CPI will further validate our idea that inflation may be a bigger story in 2016 than the consensus currently expects.

Bottom line, this week is all about the Fed, and specifically how they signal when to expect the second rate hike (remember March 2016 is too soon, and June is just right). Beyond that we will get more insight into the state of manufacturing in the US and across the globe, and that’s important because we won’t see any material acceleration of economic growth in the US or globally until manufacturing truly stabilizes.


Weekly Economic Cheat Sheet 12.7.2015

Last Week

Last week had the potential for economic data and central banking announcements to cause big volatility in the markets, and they did not disappoint. But, the bottom line is that a rate hike in December is now all but certain while the dollar rally has been temporarily capped thanks to the ECB’s underwhelming actions (at least compared to the markets unrealistic expectations).

Meanwhile, actual global manufacturing activity disappointed last week, although that was generally ignored by markets. Beyond the jobs report, it’s important to note last week’s data wasn’t very good.

Starting with the jobs report, it fell right into the middle of our “Just Right” range at 211K vs (E) 190K. Not only was the headline “Just Right” but so were the details: Unemployment stayed at 5%, wages grew a modest 0.2% in November and are up 2.3% yoy (down from 2.5% in October), and U-6 Unemployment (which measures underemployment) ticked up 0.1% to 9.9%.

In total, the jobs report wasn’t that strong and there were some soft spots, but it perfectly backs the one-and-done Fed policy of a December rate hike, and then nothing until June 2016—and that’s why it ignited such a massive rally in stocks Friday. Whether that actually plays out remains to be seen, but for the short-term bulls that jobs report was borderline perfect.

Looking at other data, global manufacturing PMIs for November were generally a disappointment. First, the official Chinese PMI dropped to 49.6 vs. (E) 49.8, undermining the “stabilization” theory, although Chinese markets took it as a catalyst that would be reason for further easing. But, we challenge that notion because Chinese officials have recently unleashed a slew of stimulus measures and there is really not a whole lot more they can or are willing to do in the near term. So, last week’s soft PMIs make the Chinese data this week more important, and while China is no longer the macro risk that it was in the late summer it remains a risk to monitor.

Meanwhile, in the US ISM Manufacturing PMI fell to 48.6, the worst level since June 2009, which was a big disappointment and also undermines October data that implied the manufacturing sector was stable. But, especially in light of the good jobs report Friday, the manufacturing PMI won’t cause the Fed to delay a rate hike in December.

The ECB decision was the big catalyst of the week as the ECB unleashed more stimulus but didn’t meet the market’s quasi-unreasonable expectations, and the resulting moves in the current markets were historic. The euro rallied 3% on short covering while the dollar dropped more than 2%. Both currencies traded to respective one-month highs and lows.

Somewhat lost in the details was the fact that the ECB actually increased the total size of the QE program to 360 billion euro with the six-month extension, more than the 300 billion expectation. So, the actual decision was not as bad as the market’s reaction. We will provide a more in-depth update on the “Long Europe” thesis in tomorrow’s report, including our opinion short, medium and longer term.

This Week

It should be a pretty quiet week economically, especially in the US. As noted, there are virtually no Fed speakers this week and little data. The undisputed highlight of the data this week will be Friday’s November Retail Sales report, which will include preliminary results from the start of the holiday spending season. Also on Friday, University of Michigan Consumer Confidence will be released, and since the market gyrations in August the Fed has watched this number, so we will too. But, to be clear, Retail Sales and consumer confidence would have to be in near freefall

Weekly Economic Cheat Sheet 11/30/15

Last Week

There was a lot of economic data last week despite the holiday, and the general takeaway is that the data reinforced the expectation that the Fed was on track to hike rates in December.

Durable Goods was the positive surprise last week as not only did the headline beat, but the key “Non Defense Capital Goods ex-Aircraft” sub-index rose 1.3%, it’s best uptick in months. That’s important because the revised Q3 GDP Report out last week showed better-than-expected business spending (called Non-Residential Fixed Investment) and if business spending can continue to accelerate that will be a unanticipated tailwind on the US economy.

Other than Durable Goods, most of last week’s numbers actually mildly disappointed, but as we stated last week none of them were bad enough to dissuade any Fed member who is in favor of a rate hike.

November flash manufacturing PMI declined more than expected to 52.6 vs. (E ) 54.5, the lowest reading in well over a year. But, that just brings the flash reading in line with most other manufacturing indices, so it’s not an incremental negative (the flash reading had stayed stubbornly high).

It wasn’t the best week for the consumer either as October Consumer Spending slightly missed estimates (up 0.1% vs. (E ) 0.3%) and Q3 consumer spending was reduced in last week’s revised Q3 GDP report (Personal Consumption Expenditures was revised to 3% from the initial 3.2%). But, both numbers remain overall healthy, and while slight disappointments, they aren’t materially shifting anyone’s outlook on the US consumer.

Finally, the housing numbers also missed as both October Existing Home Sales and New Home Sales printed below estimates, but that was mostly due to low supply (low inventory reducing sales as opposed to low demand). The housing data from Sept./Oct. hasn’t been great, but again, it’s not nearly bad enough to make anyone think the housing recovery is about to stall.

Finally, looking at inflation, the Core PCE Price Index contained in last week’s Personal Income and Outlays report was slightly weaker than estimates (flat vs. an expected increase of 0.2%) and the year-over-year measure was unchanged at 1.3%, well below the Fed’s 2.0% target. But, the wage data contained in the report was strong as wages and salaries grew 0.6%, a very strong reading. That confirms what we’ve seen in the recent jobs reports, and since wage inflation often leads broad inflation that prevents this report from being dovish.

Bottom line, last week reinforced that US economic growth isn’t great (we remain stuck in 2.5% – 3.5% annual growth) but that’s still enough to get the Fed to likely move off 0% rates in December.

This Week

This week will likely determine not only whether the Fed hikes rates in December, but also how the remainder of the year will play out for markets (meaning it could remove the chances of a late, end-of-year pullback if the data is positive).

The calendar is very busy but there are five key market moving economic releases/events to focus on (in order of importance): November Jobs Report (out Friday), Dual Yellen Speeches (Wed/Thurs), ECB Meeting (Thurs), Global November Manufacturing PMIs (tonight/tomorrow) and Global November Composite PMIs (Thursday).

First, it’s “jobs week” so we get ADP Wednesday, claims Thursday and the government report Friday. We will do our “Goldilocks” preview later this week, but bottom line is this number will have to be pretty bad to delay a rate hike in December. And importantly, if it’s strong it could make a rate hike in December go from “expected” to “certain,” and how the market will react to that is an unknown.

Second, Yellen makes two speeches Wednesday/Thursday that could further cement the expectation for a rate hike. Fed officials have been coy about being too committal to a hike, but the FOMC also doesn’t want to surprise markets, so now would be the time to drop more hints.

Third, the ECB meeting Thursday is the most anticipated since the bank announced QE back in January, and expectations for how the ECB will increase QE are all over the place (we will do a preview later in the week). This is important because if the ECB dovishly surprises, then the euro could plunge and the dollar could rally, and that may weigh on stocks and the Fed should the gains be too much, too soon (the Fed is afraid of a “too strong” dollar).

Finally, global growth remains very much in focus, especially in China. The PMIs out tonight are important because they need to show further stabilization, and if the Chinese government manufacturing PMI can move towards 50 and above, that will be a positive. In the US and Europe there shouldn’t be any major surprises contained in the PMIs, but there’s a chance the US ISM Manufacturing PMI could fall below 50 (remember it was 50.1 in October) and if it does, that will negatively surprise markets. Global Composite PMIs Thursday will also be important to reinforce the fledgling notion that global economic growth has stabilized and is starting to turn very slightly higher.

Weekly Economic Cheat Sheet 11/23/15

Last Week

Economic data last week largely met expectations and the key takeaway was that the data further reinforced the expectation by the market that a rate hike is coming in December.

Starting with the manufacturing sector, there were three notable releases: Two from November (Empire Manufacturing Survey and Philly Fed Survey) and one from October (Industrial Production). And, they all said the same thing: While the absolute state of manufacturing activity in the US remains sluggish due to a strong dollar and slack international demand, manufacturing activity in the US isn’t getting any worse and is showing some signs of stabilization, which is a relative positive.

Empire and Philly Manufacturing Surveys were mixed as Empire missed estimates (-10.7 vs. (E) -5.0) while Philly slightly beat estimates (1.9 vs. (E) 0.0). Positively, both results were improvements over October and the details of each were encouraging (New Orders, the leading indicator for each survey, remained negative but increased from October levels). So, there were signs within these surveys that again point to stabilization in the manufacturing sector.

October Industrial Production slightly missed the headlined (up 0.1% vs. (E) 0.2%) but that was misleading as the weakness was due to utility and mining production. The manufacturing sub-index rose a healthy 0.4% (meeting expectations) and importantly the August manufacturing sub-index was revised higher from –0.4% to –0.2%, again implying stabilization. Bottom line, the manufacturing data, while not great in an absolute sense, won’t make the Fed re-think a rate hike in December.

Other economic data from last week was largely in line with expectations. October CPI met estimates and the core year-over-year metric was unchanged from October at 1.9%. But, non-commodity-related inflation continues to show signs of bottoming and an upside surprise in inflation may finally be in the cards for Q1 2016. Notably, service sector inflation rose 0.3% in October, which is a pretty hot pace.

Looking at the Fed, the highlight was the FOMC minutes released last Wednesday, but there was again a small army of Fed speakers throughout last week. The market liked the FOMC minutes because while it further solidified the expectation for a December rate hike, the minutes also highlighted the desire of the FOMC to raise rates very gradually, reflecting the “one-and-done” policy that stock investors are craving (and as a result is was spun as dovish). Whether the FOMC can be that gradual will depend on inflation (which they have a bad history of forecasting) but last week the FOMC minutes were taken as incrementally dovish over the longer term.

This Week

This will be a holiday-shortened week but there’s going to be a fair amount of important data crammed in between now and Wednesday. The two highlights will be the flash November manufacturing PMIs out later this morning, and then the Core PCE Price Index contained in the October Personal Income and Outlays Report out Wednesday morning.

Those are important because they are the only ones that have the potential to shift the Fed’s opinion on a rate hike in December. But, to be fair, both readings will have to be awful to make the Fed reconsider December (something like a flash PMI well below 50 and y-o-y Core PCE Price Index well below 1.3%).

Beyond those two numbers, the next most important report is the revised Q3 GDP out tomorrow (there are no major revisions expected and the key detail in this report will be the PCE data, i.e. consumer spending).

October housing reports continue this week with Existing Home Sales reported later this morning and New Home Sales released Wednesday. Housing showed some signs of losing momentum in September, so these reports will carry a bit more weight than usual, although again they would have to be horrid to make the Fed reconsider December.