Chart of the Day: Natural Gas Rally
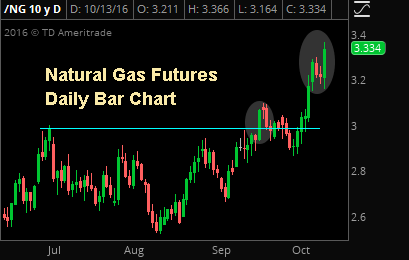
Since we recommended getting long natural gas on September 21st, futures have rallied more than 17% trough-to-peak and we believe there is still more room to run to the upside in both the near and longer terms.
Since we recommended getting long natural gas on September 21st, futures have rallied more than 17% trough-to-peak and we believe there is still more room to run to the upside in both the near and longer terms.
Another episode with Tom Essaye and Adam Johnson on Market’s Bell discussing: Election Investing, Stock Market Sweet Spot & Bonds Italian Style.
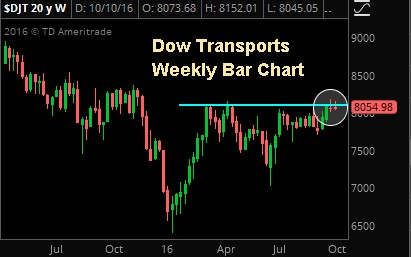
Dow Theory has been bearish since July of 2015 however, the Transports are threatening to confirm a bullish signal in the DJIA from earlier in the year which would shift the historically accurate indicator back in favor of the bulls.
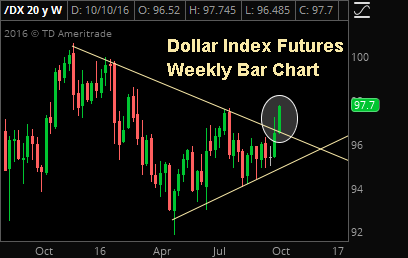
The dollar index broke out to levels not seen since early March yesterday as investors continue to price in a December rate hike.
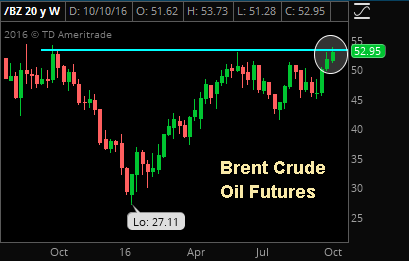
The global benchmark, Brent crude oil futures rallied to a one year high yesterday on the back of bullish comments from Russian President Vladimir Putin as the speculative, “production-cap rally” continues.
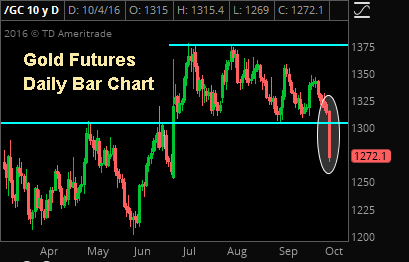
Gold plunged to a 3 month low yesterday amid a hawkish shift in Fed policy expectations this week. Despite the near term breakdown however, the long term trend is still bullish.
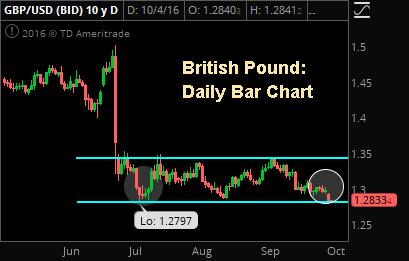
The pound fell to a 3-month low yesterday thanks to news that British PM May set a March deadline for formally beginning the Brexit Process.
WSJ best-selling author Simon Constable puts a little British spin on the US economy where to invest now. He’s fun, brutally honest and wicked smart.
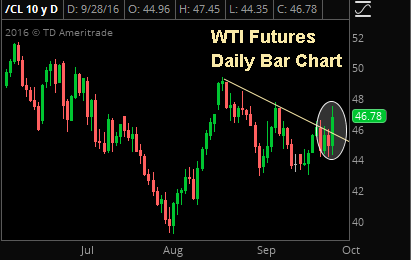
Crude oil rallied as much as 6% yesterday, materially breaking through a 6 week old downtrend line after OPEC officials “came to an understanding” about enacting a production ceiling at their meeting in November.
People on Wall Street have a great sense of humor.
I remember thinking that years ago when I started my career at Merrill Lynch, and despite the fact that we’ve witnessed a lot of changes in this business over the years (most of them not good, in my opinion) I’m happy to say there are still a lot of funny people in this industry.
One of them is this guy “IvantheK” who I think is a trader (you never can tell on Twitter).
After the Fed meeting last week, he tweeted this image:
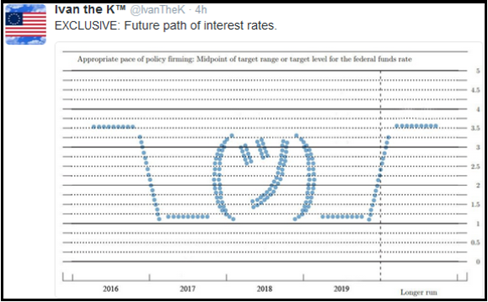
That’s a pretty accurate description of most people’s opinion of Fed policy!
Unfortunately, a dysfunctional Fed isn’t an excuse for advisors (or analysts) to underperform, and blaming a confused Fed for not having a good year won’t keep a client.
So, to keep growing both our businesses (yours and mine), we’ve got to get this market “right’ regardless of how difficult it is.
Given that, I’m happy that we again cut through the noise last week and gave our subscribers the need-to-know information about the Fed and BOJ.
Last week, we said the risk going into these central bank decisions wasn’t that they’d cause a pullback.
Instead, it was that they’d inadvertently put a “cap” on future stock gains.
And, we think that fear was realized because neither central bank was dovish enough to make us think global bond yields will drop towards post-Brexit lows.
And, without that tailwind, our fear is that the S&P 500 is now “stuck” at 2200.
Without the US 10-year Treasury yield heading towards 1%, there isn’t any justification to buy the S&P 500 above 17X earnings (I say the S&P 500 is stuck at 2200 because 17 * $130 (the 2016 S&P 500 EPS) = 2210).
So, in last Thursday’s Report, we said that while the post-FOMC rally was enjoyable, it was just a “relief” rally (relief that the BOJ and Fed weren’t outright “hawkish”) and not indicative of a new bull market.
And, over the past two trading days, the market has validated that analysis as the S&P 500 has retraced the entire post-FOMC rally.
Over the last week, we gave paid subscribers:
And all it took was a 7 minute read each trading day at 7 a.m.!
That’s how we turn our daily macro report into a tool advisors use to grow AUM.
Now that the key events of September are (mostly) behind us, focus is shifting towards the fourth quarter, and while the general consensus on Wall Street is that it could be a quiet few months, there are still several key events looming between now and December 31
that will decide whether the S&P 500 finishes 2016 positive or negative, and we’ve offered an excerpt of that list as a courtesy.
What’s Next for Markets: 5 Key Questions
Nearly six weeks ago in mid-August, when almost every analyst on Wall Street was trying to cram in a little extra vacation time, we told our paid subscribers (and you via these free excerpts) that the period of low volatility was about to end, because starting with the Fed’s Jackson Hole Conference (in late August) we were entering a critical stretch of key events that would largely decide whether stocks resume the July rally or not.
Since then stock volatility has risen sharply and the upward momentum in stocks has been broken.
Now, we’re saying it again:
The rest of the year will likely not be smooth sailing, and there is a lot of potential for volatility.
And with the S&P 500 up just over 4% year to date, there’s not a lot of room for error from a performance standpoint.
We have identified five key questions that, depending on their outcome, will ultimately decide whether the S&P 500 ends 2016 positive or negative:
Question 1: Will the ECB Extend QE? It’s widely assumed the ECB will extend its current QE program in December, but that’s not a given, and if they disappoint markets, we could see a sharp pullback at the worst time – three weeks until year end.
Question 2: Will the BOJ Taper QE This Year? The Bank of Japan basically admitted it’s “out of bullets” last week, so now it’s just a matter of time until they actually reduce their QE program (it’s not working and risks doing more harm than good). If/when the BOJ does taper QE, that will hit stocks.
Question 3: Does the Italian Referendum Pass? This is easily the most important issue for markets you likely haven’t heard about. This vote isn’t the Italian version of Brexit, but it isn’t very far from it, either. Later this year Italy will vote on a series of constitutional reforms, and if the vote fails, that will set up a “Brexit” type vote in 2017.
Question 4: Does the US Election Cause a Surprise? Even after last night’s debate this election will be closer than anyone thought possible, and it has the potential to cause a surprise and rattle markets.
Question 5: Does OPEC Cut Production: Falling oil is still a weight on stocks, so if OPEC does not cut or cap production at tomorrow’s meeting, the last date to do so in 2016 will be in late November. Plunging oil caused a drop in stocks last December, and the potential is there for a repeat.
In tomorrow’s paid subscriber edition of The Sevens Report, we will tell our subscribers the “Need to Know” on each of these looming events including:
It is our hope that subscribers print this section of the report out and tape it to their desks, as it literally will be a road map to help advisors and investors navigate the remainder of the year.
Finally, our paid subscribers know we will monitor these looming events, but more importantly we’ll be watching for macro surprises that aren’t on the calendar – including:
That’s how we are going to help subscribers successfully navigate a volatile fourth quarter, so they can continue to focus on growing their business and strengthening client relationships.
The fourth quarter helps you lay the foundation for more allocations in the New Year, and we’re determined to help advisors “win” in Q4!
What Does This Mean for Markets (Stocks, Bonds, Commodities, Currencies)?
The S&P 500 being capped at 2200 does leave the markets vulnerable to macro shocks.
In fact, this market environment is starting to look at a lot like last year.
From May 2015 to July 2016 the S&P 500 was “capped” at (basically) 2100, and because it was capped, it was susceptible to sharp macro-economic inspired pullbacks:
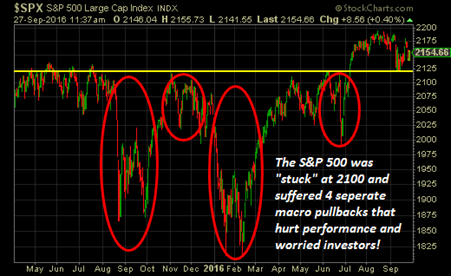
Obviously the market has recovered from these dips, but if an advisor had been able to tactically reduce exposure during just part of these declines, the cumulative effect on performance would be huge, and that means happy clients and more assets!
That is what we are very focused on doing for our paid subscribers over the next three months.
We are going to make sure they:
If you don’t have a morning report that is going to give you the plain-spoken, practical analysis that will help you navigate the fourth quarter and help you get positioned properly to outperform into year end, then please consider a quarterly subscription to The Sevens Report.
There is no penalty to cancel, no long-term commitment, and it costs less per month than one client lunch!
With thousands of advisor subscribers from virtually every firm on Wall Street and a 90% initial retention rate, we are very confident we offer the best value in the private research market.
I am continuing to extend a special offer to new subscribers of our full, daily report that we call our “2-week grace period.”
If you subscribe to The Sevens Report today, and after the first two weeks you are not completely satisfied, we will refund your first quarterly payment, in full, no questions asked.
Click this link to begin your quarterly subscription today.
Increased Market Volatility Will Be an Opportunity for the Informed Advisor and Investor
We aren’t market bears, but we said consistently that things were going to be volatile in 2016, and we were right!
And, as we approach the biggest event for markets since Brexit (the BOJ meeting next Wednesday) the advisor who is able to confidently and directly tell their nervous clients what’s happening with the markets and why stocks are up or down, and what the outlook is beyond the near term (without having to call them back), will be able to retain more clients and close more prospects.
We view volatility as a prime opportunity to help our paid subscribers grow their books and outperform markets
by making sure that every trading day they know:
1) What’s driving markets
2) What it means for all asset classes, and
3) What to do with client portfolios
We monitor just about every market on the globe, break down complex topics, tell you what you need to know, and give you ETFs and single stocks that can both outperform the market and protect client portfolios.
All for $65/month with no long term commitment.
I’m not pointing this out because I’m implying we get everything right.
But we have gotten the market right so far in 2016, and it has helped our subscribers outperform their competition and strengthen their relationships with their clients – because we all know the recent volatility has resulted in some nervous client calls.
Our subscribers were able to confidently tell their clients 1) Why the market was selling off, 2) That they had a plan to hedge if things got materially worse and 3) That they were on top of the situation.
That’s our job, each and every trading day, and we are good at it.
We watch all asset classes to generate clues and insight into the near-term direction of the markets, but our most important job is to remain vigilant to the next decline.
While we spend a lot of time trying to identify what’s really driving markets so our clients can be properly positioned, we also spend a lot of time identifying tactical, macro-based, fundamental opportunities that can help our clients outperform.
If you want research that comes with no long-term commitment, yet provides independent, value-added, plain-English analysis of complex macro topics, click the button below to begin your subscription today.

Finally, everything in business is a trade-off between capital and returns.
So, if you commit to an annual subscription, you get one month free, a savings of $65. To sign up for an annual subscription simply click here.

Best,
Tom Essaye
Editor, The Sevens Report