What’s in Today’s Report:
Futures are trading higher this morning while international markets were mixed overnight as investors weighed stimulus hopes against the continued spread of the coronavirus.
As cases of COVID-19 topped 90,000, the RBA was the first central bank to cut its official “cash rate” to a record low of 50 basis points overnight largely due to the outbreak.
Economically, the Eurozone HICP Flash for February and Unemployment Rate for January both met expectations overnight at 1.2% and 7.4%, respectively.
Today, there are a few potential catalysts to watch including one economic data point: Motor Vehicle Sales (E: 16.8M) and one Fed speaker after the close: Evans (6:30 p.m. ET), while politically, “Super Tuesday” will be in focus.
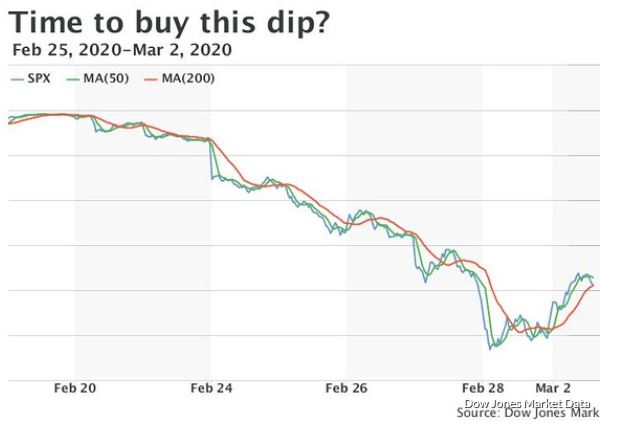
The coronavirus outbreak remains the single most important factor for global markets right now, however, and if there is a significant rise in reported cases of deaths related to the virus, this week’s risk-on money flows could begin to fade and potentially give way to more volatility.
Conversely, any news regarding emergency stimulus measures, especially by G7 nations could help this week’s rally extend higher.