Posts

Last Week and This Week in Economics, May 1, 2017

The Sevens Report is everything you need to know about the markets by 7am each morning in seven minutes or less. Free trial at 7sReport.com.

Economic data continued to underwhelm last week and the gap between soft sentiment surveys and actual, hard economic data remains wide, and that gap remains a medium term risk on the markets.
The Sevens Report - This week and last week

Last week in Economics – 4.24.17

Looking at the headliner from last week, Q1 GDP, it was underwhelming, as expected. Headline GDP was just 0.7% vs. (E) 1.1%, and consumer spending (known as Personal Consumption Expenditures or PCE) rose a mea-sly 0.3%. But, the 0.7% headline met the soft whisper number and that’s why stocks didn’t fall hard on Friday.

That GDP report came on the heels of another underwhelming Durable Goods number. The headline missed estimates but the more importantly, New Orders for Non-Defense Capital Goods ex-Aircraft rose just 0.2% vs. (E) 0.4%, although revisions to the February data were positive.

Meanwhile, inflation metrics firmed up last week. First, the PCE Price Index in Friday’s GDP report rose 2.2% vs. (E) 2.0%, while the Employment Cost Index, a quarterly gauge of compensation expenses, rose 0.8% in Q1 vs. (E) 0.4%. Those higher inflation readings were why you saw the dollar rally pre-open Friday despite the disappointing GDP report.

Bottom line, the economic data over the past several weeks hasn’t been “bad” and it’s not like anyone is worried about a recession. But, the pace of gains has clearly slowed, and until we see a resumption of the economic acceleration many analysts were expecting at the start of 2017, any material stock rally from here will not be economically or fundamentally supported (and remember, it was the turn in economic data back in August/September that ignited the late 2016 rally. Yes, the election helped, but the momentum was positive before that event, so economics do matter).

This Week in Economics – 5.1.17

Economic data this week could go a long way towards helping to resolve the large gap between soft sentiment surveys and hard economic data, given the large volume of economic reports looming this week.

First, it’s jobs week, so we get the ADP Employment Report on Wednesday and the official jobs report on Friday. We’ll do our typical “Goldilocks Jobs Report Preview” on Thursday, but after March’s disappointing jobs number, the risks to this report are more balanced (it could easily be too hot if the number is strong and there are positive revisions, or it could be too cold and further fuel worries about the pace of growth).

Second in importance this week is the Fed meeting on Wednesday. The reason this is second in importance is because it’s widely assumed the Fed won’t hike rates at this meeting (June is the next most likely date for a rate hike), although the Fed has turned slightly more hawkish so there’s always the possibility. We’ll send our FOMC Preview in Wednesday’s report but the wildcard for this meeting is whether the Fed gives us any more color into how it plans to reduce its balance sheet. If the Fed does reference or start to explain how its plans to reduce its balance sheet, that could be a hawkish surprise for markets.

Finally, we get the global manufacturing and composite PMIs this week. Most of Europe is closed today for May Day so just the US ISM Manufacturing PMI comes today, with the European and Japanese numbers out tomorrow. Then, on Wednesday, we get the US Service Sector PMI and global composite PMIs on Thursday. The global numbers should be fine but the focus will be on the US data. In March we saw a loss of positive momentum in these indices but the absolute levels of activity remained healthy. If we see more moderation and declines in the ISM Manufacturing and Non-Manufacturing PMIs in April, that will stoke worries about the overall pace of growth in the economy and that will be a headwind on stocks.

Bottom line, this a pretty pivotal week for the markets. On one hand, if economic data is strong and the Fed a non-event, the S&P 500 could push and potentially break-through 2400. Conversely, if economic data is underwhelming and the Fed mildly hawkish, we could easily see last week’s earnings/French election rally given back, and the S&P 500 could fall back into the middle of the 2300-2400 two months long trading range.

The Sevens Report is your weekly cheat sheet. Get a free two-week trial: 7sReport.com.

Jobs Report Preview, April 6, 2017

For the second month in a row the major issue for tomorrow’s jobs report is simple: Will it cause the Fed to consider more than three rate hikes in 2017? If the answer is “yes,” then that’s a headwind on stocks. If the answer is “no,” then stocks should comfortably maintain the current 2300-2400 trading range.

So, tomorrow’s jobs report is once again potentially the most important jobs number in years, as it has the ability to fundamentally alter the market’s perception of just how “gradual” the Fed will be in hiking rates.

“Too Hot” Scenario (Potential for More than Three Rate Hikes in 2017)

  • >250k Job Adds, < 4.6% Unemployment, > 2.9% YOY wage increase. A number this hot would likely ignite the debate about whether the Fed will hike more than three times this year (or more than 75 basis points if the Fed hikes 50 in one meeting). Likely Market Reaction: Withheld for subscribers. Unlock by signing up for your free trial: 7sReport.com.

“Just Right” Scenario (A June Rate Hike Becomes More Expected, But the Total Number of Expected Hikes Stays at Three)

  • 125k–250k Job Adds, > 4.7% Unemployment Rate, 2.5%-2.8% YOY wage increase. This is the best-case scenario for stocks, as it would imply still-stable job growth, but not materially increase the chances for more than three rate hikes in 2017. Likely Market Reaction:Withheld for subscribers. Unlock by signing up for your free trial: 7sReport.com.

“Too Cold” Scenario (A June Rate Hike Becomes in Doubt)

  • < 125k Job Adds. Given the market’s sensitive reaction to the soft auto sales report earlier this week, a soft jobs number could cause a decent sell-off in equities. As the Washington policy outlook continues to dim, economic data needs to do more heavy lifting to support stocks. So, given the market’s focus on future growth, the bottom line is bad economic data still isn’t good for stocks. Likely Market Reaction:Withheld for subscribers. Unlock by signing up for your free trial: 7sReport.com.

Skip the jargon, arcane details and drab statistics from in-house research, and get the simple analysis that will improve your performance. You can join hundreds of advisors from huge brokerage firms like Morgan Stanley, Merrill Lynch, Wells Fargo Advisors, Raymond James and more… see if The Sevens Report is right for you with a free trial.

Bond Market Problems (That May Become Stock Market Problems), April 5, 2017

This is an excerpt from today’s Sevens Report—everything you need to know about the markets in your inbox by 7am, in 7 minutes or less.

One of the reasons I watch all asset classes so closely is because I’ve learned that other sectors often will confirm (or not confirm) a move in the stock market. Right now we are getting a pretty notable non-confirmation from the bond market.

Bond market problemsSpecifically, when stocks rally I like to see: 1) Bond yields rising, which reflects investors expecting greater economic growth and inflation (two stock positive events). 2) A steepening yield curve, which also reflects rising inflation expectations and increased demand for money via loans (something that has been sorely missing from this recovery). 3) I like to see “riskier” parts of the bond market, specifically junk bonds, rising (or at least holding flat) as investors show confidence in corporate America by lending money to riskier companies in search of greater yield (it’s an anecdotal risk-on signal).

Throughout Q4 2016, that’s exactly what we got. First, the yield on the 10-year Treasury rose from 1.54% in late September, to 2.40% at year end. Second, the yield curve steepened as the 10’s-2’s spread rose from 0.81% on Sept. 29 to 1.25% on Dec. 30. Finally, junk bonds were broadly flat during that period (although with notable volatility).

Since the start of 2017, the opposite has occurred. The 10 year started at 2.44% but now is sitting at 2.35%. The 10’s-2’s spread has decreased from 1.23% on Jan. 1 to 1.11% on Monday (the low for the year). Finally, junk bonds rallied through March with stocks, but have since given back some of those gains. If JNK (the junk bond ETF) breaks $36.19 that will be the first “lower low” of 2017, and a negative technical signal.

Point being, the bond market is reflecting an outlook that is comprised of slower growth, less inflation, and more general concern—which is almost the exact opposite of what we’re seeing in stocks right now.

To be clear, this non-confirmation isn’t a guaranteed death sentence for a stock rally. Bond markets gave non-confirmation signals consistently in 2015 when Europe was on the verge of deflation because of the flood of European money into Treasuries, which sent bonds higher and yields lower despite a stock rally. But, that’s not happening now.

So, the “gaps” in this environment are growing in size and number. The gap between political expectations and likely reality regarding tax cuts is as wide as it’s even been. The gap between hard and soft economic data continues to widen as sentiment indicators continue to surge. Now, the gap between bond market direction and stock market direction is widening.

Bottom line, the trend in stocks remains higher, but there are cracks appearing in the proverbial ledge stocks are standing on, and we better get some positive catalysts soon, otherwise we are in danger of a real pullback.

Help your clients outperform markets with a free two-week trial of the Sevens Report.

Healthcare Vote: Macro and Micro Implications, March 23, 2017

Join hundreds of advisors from huge brokerage firms like Morgan Stanley, Merrill Lynch, Wells Fargo Advisors, Raymond James and more… see if the Sevens Report is right for you.

The healthcare vote in the House later today will have an effect on stocks in the short and long term, regardless of the outcome, so I wanted to run down the various scenarios along with sector winners and losers depending on whether the bill passes or fails.

US Capitol

Healthcare Vote: Macro and Micro Implications

Scenario #1: Bill Passes

Likely Short-Term Market Reaction: Knee-jerk, risk-on rally that likely will see cyclical sectors outperform.

Impact On Other Assets: Dollar up/bonds down/gold down/commodities down (all due to the perceived increased likelihood of tax cuts). Basically, this would be a short-term reignition of the “reflation trade/Trump-on trade” that’s driven markets higher since the election.

Likely Long-Term Market Reaction: Not a bullish game changer. Despite the likely positive reception by the market, this event by itself won’t be a catalyst for the market to move new highs. That’s because even if the healthcare law passes the House, it still has little-to-no chance of passing the Senate, and as such probably won’t become law. So, while it would be an incremental step towards the ultimate goal of corporate tax cuts, it still wouldn’t be material progress. Longer term, this outcome wouldn’t make me add or reduce stock exposure… it would elicit a “wait and see” response.

Effect on the Healthcare Sector and ETFs: This section is for subscribers only. You can sign up for a free trial to access at 7sReport.com

Next Important Event in this Scenario: Memorial Day. If the bill passes the House, then markets will give the Republicans more of a benefit of the doubt. However, healthcare needs to be done by late April/early May (or Memorial Day at the latest) if corporate tax cuts can be completed in 2017, so the clock will soon be ticking.

Scenario #2: Bill Fails

Likely Short-Term Market Reaction: A resumption of Tuesday’s sell-off. Cyclical sectors led by banks would likely pull markets lower, and a drop down through sup-port at 2300 in the S&P 500 would not be at all surprising by the end of the week. Defensive sectors would out-perform.

Impact On Other Assets: Dollar down (likely big)/bonds up (10 year yield could break down through 2.30%)/gold up (likely big)/commodities up (all due to the perceived reduced likelihood of tax cuts). Basically, this would cause a short-term reversal of the “reflation trade/Trump-on trade” that’s driven markets higher since the election, and we can expect a similar trading pattern to Tuesday.

Effect on the Healthcare Sector: This section is for subscribers only. You can sign up for a free trial to access at 7sReport.com

Next Important Event in This Scenario: Memorial Day. If the bill fails, the market will hope Republicans pivot and focus on tax cuts, and perma bulls will herald that as a positive. However, make no mistake, a failure of this bill to pass is not a positive for tax cuts, where the fight over border adjustments will make healthcare look tame. Regardless, if there is a pivot to tax cuts, then there needs to be concrete motion on a tax cut bill by Memorial Day, otherwise markets will begin to doubt tax cuts in 2017, which will be a market negative.

The Sevens Report is the daily market cheat sheet our subscribers use to keep up on markets, seize opportunities, avoid risks and get more assets. Start your free two-week trial today.

Oil Outlook: Getting More Bearish, March 15, 2017

Oil Rig - Oil Report was BearishWhy the Monthly OPEC Report Was Bearish Oil

An excerpt from today’s Sevens Report—get a free 2-week trial of the report with no commitments.

Oil remains the big story, as its early morning sell-off to multi-month lows prompted a pullback in stock futures, and ultimately the major US equity indices opened lower. WTI futures finished the day down 1.43%, only slightly above where they opened ahead of the late-November OPEC meeting, where members agreed to collectively cut output.

OPEC released its monthly oil market report yesterday, and the big catalyst in the data was a self-reported increase in February oil production by the de facto leader of the cartel, Saudi Arabia. According to direct communication, Saudi Arabian oil output rose 263.3K b/d to 10.01M b/d. The dip below the psychological 10M mark in early 2017 helped futures stay afloat above $50, as Saudi Arabia was showing their commitment to price support by cutting below their allotted quota (which in fairness they are still below). While data gathered by secondary sources showed another drop of 68.1K b/d to 9.80M b/d in Saudi production, the markets focused on the bearish direct communication data, as it suggests that Saudi Arabia’s commitment to oil cuts may be becoming exhausted.

Another notable takeaway from the release was that OPEC only projects that US oil supply will grow at 340K b/d in 2017. Still, at the current pace (which we will admit does not seem sustainable through the medium term), US producers have already brought 318K b/d online in 2017. Today’s EIA report very well could show an increase through that annual expected rise of 340K b/d.

Bottom line, the rapid increase in US production in recent months has been the biggest long-term headwind for the oil market, as it has offset the efforts of the global production cut agreement while simultaneously causing angst within the ranks of OPEC (namely the Saudis) as they start to see market share slip away.

Without the full commitment of Saudi Arabia to the global production cut agreement, the deal loses a lot of its luster, as they are the key player who has always taken on the bulk of the cuts and taken the near-term hit in market share for the longer-term benefit of the entire cartel. Meanwhile, “compliance cheating” by other members is historically high, and the chances that compliance remains as high as it is right now if Saudi Arabia begins to increase production are essentially zero.

The Sevens Report is in your inbox by 7am each morning. Save time each morning by getting in-depth and jargon-free analysis of stocks, bonds, commodities, currencies, and economic data. Sign up for your free 2-week trial.

Senate Math Primer. March 7, 2017

Senate Math Primer from the Sevens Report: One of the easiest ways to cut through the seemingly unending amount of political noise in the markets is to focus on the fact that there are only two important questions that need to be answered.

  1. Will Republicans agree on border adjustments and a corporate tax cut?
  2. Can that plan get approved in the Senate?
Senate in Session

Republicans have a simple 52 to 48 majority—but that’s not really that powerful.

We’ve already covered the first question from multiple angles in the full subscriber edition of the Sevens Report, but I think the second question is just as important.

In fact, part of the reason I’m covering this is because I get the sense that a lot of people think that once a plan has general Republican support it will automatically become law, because Republicans “control” the House, Senate and the presidency.

While the first and the last are truly under control from Republican leadership, the Senate is anything but.

Looking at the math, as mentioned yesterday, Republicans have a simple 52 to 48 majority—but that’s not really that powerful.

First, it’s well short of a filibuster-proof 60-person majority, and there’s zero chance eight Democrats will break with Republicans on Obamacare or corporate tax cuts.

That’s why both those issues have to be passed via a budget process called “reconciliation.” Reconciliation only requires a simple majority, so 52 to 48 would work.

But, it gets more complicated than that.

First, to say Republicans have a hard 52 votes on any issue is an overstatement. Senator Susan Collins of Maine (technically a Republican) acts much more like an independent. The same can be said for Alaska Senator Murkowski (she’s taking a hard line against supporting an Obamacare repeal that rolls back Medicaid expansion).

Then, there are Senators McCain and Graham. Both are solid Republican votes, but I think it’s fair to say they despise President Trump for multiple reasons. So while it’s unlikely they’d derail passage of Obamacare repeal/replace or tax cuts, they are going to be tough “gets.”

Finally, Rand Paul is more Libertarian than Republican, and he (and others) will have a hard line approach to any tax cuts that might increase the deficit.

Bottom line, while Republicans “control” the legislative and executive branches of government, the Senate is still a bottleneck in the legislative process, and getting Obamacare repeal/replace through the Senate by Memorial Day will be a tough task—never mind corporate tax reform by the August recess (remember, there aren’t even hearings scheduled for the Supreme Court nominee yet).

Again, I’m not trying to throw cold water on this rally, or the optimism fueling it. I’m just trying to keep everyone focused on facts, and the outlook for passage of major reforms through the Senate remains dicey at best.

Cut through the noise and understand what’s truly driving markets, as this new political and economic reality evolves. The Sevens Report is the daily market cheat sheet our subscribers use to keep up on markets, seize opportunities, avoid risks and get more assets. Sign up for your 2-week free trial at 7sReport.com.

How Many Rate Hikes in 2017? Last Week and This Week: March 5, 2017

The Economics excerpt from today’s Sevens Report, which focuses on the most important financial news and takeaways for investors, financial advisors, and CPA’s, last week and this week.

Even uber-dove Lael Brainard supported potentially hiking in March.

Last Week:

The major takeaway from the economic data and Fed speak last week is that because of continued strong data and hawkish Fed speak, a March rate hike now is expected by the markets. Probability (according to Fed Fund futures) of a rate hike on March 15 rose from just over 20% two weeks ago, to over 70% at the end of this week… and that was a legitimate surprise for markets.

The reason that change didn’t cause a pullback in stocks is simple. Economic data last week showed continued acceleration in growth and inflation, and as such that helped cushion the blow from the increased rate hike expectations.

To that point, there were three big numbers from last week and they all beat estimates. February ISM Manufacturing PMI rose to 57.7 vs. (E) 56.4, February ISM Non Manufacturing PMI rose to 57.6 vs. (E) 56.5. And, the core PCE Price Index (the Fed’s preferred measure of inflation) rose 0.3% in February, the biggest monthly increase since January 2016. While the core PCE Price Index rose 1.7% yoy, same as January, the headline PCE Price Index rose 1.9% yoy, just below the Fed’s 2% target and the highest level since February 2013!

Not every economic data point was strong last week (Pending Home Sales missed estimates as did Core Durable Goods. And, headline revised Q1 GDP was a touch light at 1.9% vs. (E) 2.1%). Still, the good data handily outweighed the bad data.

Bigger picture, it’s hard to understate how important continued good economic data has been for markets in 2017. Strong data has helped buy Washington more time on corporate tax cuts, and now it’s helping to cushion the blow from a potentially more hawkish Fed. Strong economic data continues to be the unsung hero of the 2017 stock rally, and it needs to continue given the increasingly bleak policy outlook, and potentially a more hawkish Fed. Frankly, watching and correctly interpreting economic data hasn’t been this important in years.

Looking at Fed speak from last week, it was almost universally hawkish. Clearly the Fed is trying to pave the road for a March rate hike. Fed officials Williams, Dudley and Powell all signaled that a rate hike could come in March, and even uber-dove Lael Brainard supported potentially hiking in March.
Then, as if there was any doubt left by the end of last week, on Friday Fed Chair Yellen basically said that if the jobs report is in line, the Fed is hiking rates (her exact words were more general, and a bit more eloquent, but that was her point).

Bottom line, the Fed appears to be sticking to its promise of three rate hikes in 2017, with the first likely coming in 10 days.

This Week:

Are Janet Yellen and the other members of the Fed supporting more rate hikes in 2017?

Jobs reports are always important economic releases but due to the potential for a March rate hike, this jobs report is even more important than normal because it will decide whether we get a hike next Wednesday.

As usual, it’s jobs week, so that means we will get the ADP report on Wednesday, weekly jobless claims on Thursday (which continue to hit levels last seen since the 1970s), and the official jobs report Friday.

I’ll do my normal “Goldilocks” jobs preview later this week, but the bottom line is that as long as this jobs re-port remains firm, the Fed will hike rates next week.

Outside of the jobs report, it’s actually a pretty quiet week, economically speaking.

In the US, the only other notable report is Productivity (out Wednesday). Low worker productivity has been a major downward influence on inflation, but it’s shown signs of ticking higher lately. A continuation of that trend will be slightly hawkish. Finally, looking internationally, China will be in focus as we get Trade Balance (Tuesday) and CPI/PPI Wednesday.

Data from China has been consistently decent (including last week’s February manufacturing and composite PMIs), so it’ll be a big surprise if the data suddenly turns south, but China remains a macro area to watch as any hints of a slowdown will make waves for global markets.

Bottom line, this week really is all about the jobs report. If it’s close to in line, the Fed will hike next Wednesday. And, if it’s hotter than expected, get ready for talk about more than three hikes this year (and that idea is a risk to stocks).

Cut through the noise and understand what’s truly driving markets, as this new political and economic reality evolves. Start your free 2-week trial of the Sevens Report today.

If A Rate Hike Is Expected, Why Aren’t Rates and the Dollar Higher? March 3, 2017

Get the simple talking points you need to impress clients and prospects from the Sevens Report. Here is an excerpt from today’s full report.

If A Rate Hike Is Expected, Why Aren’t Rates and the Dollar Higher? 

If a rate hike is expected, why isn’t the dollar index higher?

That’s a fair question to ask, given two weeks ago there was no expectation of a May rate hike. Then, a week ago, there was no expectation of a March rate hike. Now, a March hike is fully expected.

Yet despite that relatively quick shift, as mentioned the Dollar Index still isn’t materially above 102, and still not close to the recent 103 high. Meanwhile, the 10-year yield is still decently below 2.60%.

The reasons we haven’t seen greater rallies in the dollar or yields are twofold.

First, a rate hike is not a foregone conclusion because of the jobs report next Friday. If it’s disappointing then a May hike makes more sense.

Second, the market still doesn’t believe the Fed is materially more hawkish. So, even if the Fed hikes now, the market still expects just three hikes the remainder of the year, which is what the Fed said in December.

The point is, the currency and bond markets still haven’t fully priced in a March hike yet, nor have they accepted the existence of a “hawkish.” Fed. However, if that jobs number is strong I believe we’ll see further upside in the dollar and yields.

But the big jumps in both will come when the market realizes the Fed is more hawkish than it currently expects, and that likely won’t happen until we see more inflation or proof of actual fiscal stimulus.

Regardless, barring an economic set back the trend higher in the dollar and rates is close to resuming, and investors should be positioned accordingly.

Cut through the noise and understand what’s truly driving markets, as this new political and economic reality evolves. Get your free two-week trial of the Sevens Report today.

How Far Could Stocks Go? Let’s Look at the Charts. March 2, 2017

How Far Could Stocks Go?

Stocks have screamed to all-time highs in recent weeks, and with new highs always comes the question of how far could stocks go? We like to regularly offer fundamental valuation updates as we did two weeks ago, but it is also important to outline what the charts are telling us as far as upside targets and key support levels for near-term price movements.

This stock market technical update is an excerpt from our March 1st Sevens Report. Claim your free 2-week trial today and cut through the jargon to specifics to support your client conversations. 

In the wake of the election there were a lot of very important technical developments. The two most notable were the shift from a bear market signal to a bull market signal in Dow Theory when the S&P was trading at 2165, and confirmation of that signal when the S&P broke to all-time highs November 21.

Currently, both the technical trend and upside momentum of the market continue to suggest the path of least resistance is higher for the medium term. That is the case in spite of the fact that there are countless fundamental uncertainties, most important are related to politics and fiscal policy.

Prices taken at market close on Feb 28.

Prices taken at market close on Feb 28.

In a situation like this, where technicals are largely divergent from fundamentals, many financial professionals and investors look for some direction as to how far stocks could rally from current levels and where a pullback would most likely pause if not reverse. So, we put together a few upside targets as well as downside support levels to watch for the S&P 500.

In a quick review, when any issue (stock, bond, commodity or currency) is trading in never-before-seen territory, there are only two ways to come up with targets in the direction of the new highs—measured moves, and likely areas of interest for options traders. The latter is relatively easy to figure out, as options volumes generally cluster around the big round numbers (in this case 2350 and 2400).


Tracking Measured Moves.

Measured moves, on the other hand, are a little more scientific. The idea behind a measured move is that if the market moved a certain distance against the dominant trend, it will more than likely move at least that far back in favor of the trend once it resumes.

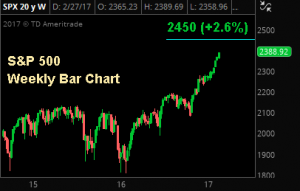
  • Our next upside target is actually a combination of two measured moves and a likely area of interest for S&P option traders: 2450. On the daily chart, a measured move can be calculated from the late-October lows (2084) to the late-December digestion area (2271), which results in a measured move to 2458 in the S&P from current levels. In a supporting fashion, a measured move on the weekly chart can be calculated from the previous S&P highs of 2126 to the February ’16 lows of 1810. That results in a target of 2442.
  • This gives us an ultimate target window of 2442-2458, which encompasses a likely options trader target of 2450.

stock market charts, March 2

  • Bottom line, we are not suggesting that this bull market will end in the mid 2400s; however, for those looking to take profits, you likely will not be alone in doing so in that window around the 2450.

Support Levels

Turning to support levels, the February melt-up in stocks has left a large “volume gap” on the chart, which basically means stocks sprinted from around 2300 to 2360. Because of the velocity of that move higher, there were not many logical support levels created in the month of February. And a set up like that raises the odds that there could be a swift move back through that area.

  • There is an initial and minor area of support around 2343, where there was minor consolidation on February 16. This area will at least be noticed by technical traders and volume-driven algorithms.
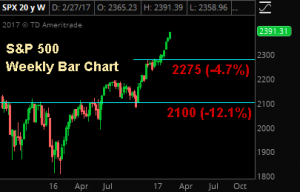
    Secondary and more formidable support lies near the previous set of new all-time highs established in December in the band between 2270 and 2280. Here there will be buyer support from both bulls who missed out on the breakout as well as faster-money short sellers looking to book profits.

March 2, book profits

  • Our final support zone is derived from a weekly timeframe, and again at a previous all-time high of 2100, where the most consolidation occurred since the tech sell-off finally ended in 2002.

These levels are meant to provide you with a general idea of the most important technical levels on either side of the broader stock market right now. This information, we have heard in the past from advisor subscribers, is very useful in conversations with clients.

Join hundreds of advisors from huge brokerage firms like Morgan Stanley, Merrill Lynch, Wells Fargo Advisors, Raymond James and more… see if the Sevens Report is right for you with a free 2 week trial.

The Political Outlook for Stimulus is Darkening, February 28, 2017

This is an excerpt from today’s Sevens Report. The Sevens Report is the daily market cheat sheet our subscribers use to keep up on markets, seize opportunities, avoid risks and get more assets. Sign up for a free 2 week trial.

It’s obviously impossible to say “when” this will matter to stocks, but I want to make very clear to everyone that the political outlook for stimulus is darkening, and the chance of any pro-growth measures hitting the markets in 2017 are falling, quickly… and sooner or later that will be a problem for this market.

To that point, yesterday there were three separate areas where the outlook for fiscal stimulus darkened. First, while Treasury Secretary Mnuchin did a good job in both his major interviews (WSJ and CNBC) he didn’t add anything incremental regarding corporate tax cuts, and was downright vague on the idea of border adjustments, which is the key to corporate tax cuts.

Yes, he did say he expects a broad corporate tax reform bill by the August recess, but that’s just repeating what Speaker Ryan has said (i.e., nothing new). Bottom line, the outlook for corporate tax cuts in 2017 (and maybe at all) continues to get worse.

Paul Ryan

Speaker Paul Ryan has said he expects a broad corporate tax reform bill by the August recess. The outlook for corporate tax cuts in 2017 continues to get worse.

There were some additional headlines regarding this issue late yesterday afternoon when President Trump told Reuters he supported “some form of border tax.” Markets initially took this as a positive (implying he was supportive of border adjustments) but that’s premature because what he meant was unclear as his subsequent comments more implied he supported tariffs in some form (not the full scale border adjustments needed to pass corporate tax reform).

Beyond Trump’s comments, the major hurdle for border adjustments and corporate tax reform remains in the Senate. There is little support for that idea in the Senate currently, and until that chances, corporate tax reform is unlikely.

Second, Axios reported that Trump is punting infrastructure spending to 2018. That was treated as a notable headline yesterday, but we and others have been saying for weeks now that infrastructure spending never was on the table for 2017. So, while this isn’t an incremental negative for the market, it was a headline that we wanted to cover.

Third, as we’ve covered, the way things are looking right now Republicans must get the repeal/replace of Obamacare done before they can tackle corporate tax reform. Well, Politico reported that Republican Alaska Senator Murkowski won’t vote for any repeal/replace that reduces the Medicaid expansion. With just a 53/47 majority in the Senate, the chances of just getting 50 votes on a repeal/replace continue to dwindle, and by all reports Republicans remain fractured on how to handle the repeal/replace.

Now, I’m not pointing this out for political reason (you know I’m politically agnostic in this Report). The reason I am pointing it out is simple: No Obamacare repeal/replace, then no corporate tax cuts in 2017, and that’s a problem for stocks (how much of a problem will depend on economic growth, inflation and interest rates, but it’s still a problem).

Bottom line, I don’t want to sound like the boy who cried wolf, but I just want to point out consistently and clearly that the gap between market policy expectations and policy reality is widening—and again, that’s a risk that should not be ignored.

This is a volatile, politically sensitive investment landscape—you need the Sevens Report to stay ahead of the changes, and to calm worried clients.