Economics, This Week and Last Week, March 20, 2017
Every Monday in the Sevens Report, you’ll find a review of last week and a preview of this week. Sign up for your free trial today and start each week “sevens strong.”
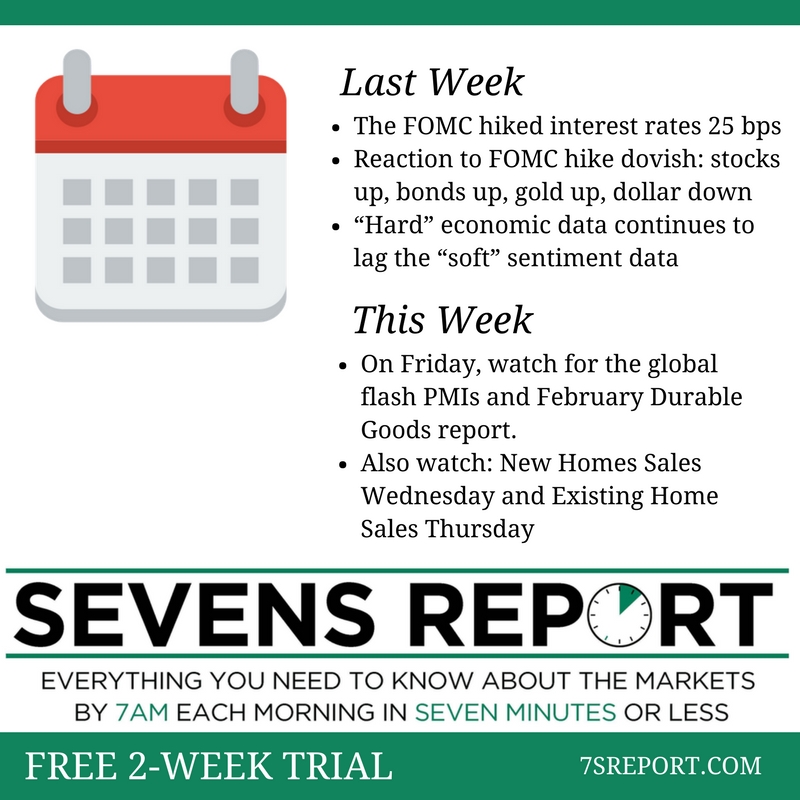
 Last week was generally “Goldilocks” from an economic data and Fed standpoint, as economic data continued to be buoyant while the Fed successfully executed a dovish hike (at least in the short term).
Starting with the Fed, the FOMC hiked interest rates 25 bps, as expected, but left the dot projections for 2017 and 2018 unchanged at three hikes each. Given market expectations for an increase in the dots, the reaction was immediately dovish (stocks up, bonds up, gold up, dollar down).
As we said last week, it’s important to see the forest for the trees. Regardless of the Fed’s projections, the first hike of 2017 came three months earlier than expected, and the question going forward isn’t whether the Fed hikes again, but “when” and “how often.”
If inflation data keeps rising and economic activity accelerates (or we actually get corporate tax cuts) the answers to those rate hike questions will be “soon,” and “more than three times.” Point being, don’t confuse the short-term dovish reaction with a reduction in risk from a hawkish Fed throughout 2017. The risk hasn’t changed.
Looking at the economic data last week, it showed an ongoing “reflation trade,” as inflation and growth data beat estimates. Both February PPI and CPI ran a touch “hot,” and showed either bigger-than-expected monthly increases (PPI) or year-over-year price increases that were the biggest in several years (headline CPI rising by 2.7%).
Meanwhile, the first economic data points from March, Empire Manufacturing and Philly Fed, also both beat expectations. Philly was 32.8 vs. (E) 30.0 and New Orders, the leading indicator of the report, rose to 38.6, which is the highest since 1983!
Actual “hard” economic data last week was a touch disappointing on the headline as Retail Sales met expectations and the “Control” group (the best measure of discretionary consumer spending) rose just 0.1% vs. (E) 0.3%. Revisions to the January data were positive and offset the disappointment, though (January control retail sales were revised to 0.8% from 0.4%).
It was a similar result with February Industrial Production being flat vs. (E) 0.2%. However, January data was revised slightly better to -0.1% vs. -0.3%. Meanwhile, the manufacturing sub-index was more positive (up 0.5% vs. (E) 0.4% and January was revised to 0.5% from 0.2%).
Bottom line, the “hard” economic data continues to lag the “soft” sentiment data (i.e. Philly/Empire Surveys) and the running estimate for Q1 GDP (the Atlanta Fed’s GDP Now) is just 0.9%, the lowest in nearly a year.
Again, it’s not an indictment of the rally just yet, but at some point, that GDP number needs to start to rise to meet the surging survey data, otherwise we’ve got a problem.
This Week: Economically speaking this will be a generally quiet week, as the notable data doesn’t come until Friday via the global flash PMIs and February Durable Goods report.
Yet despite the small number of reports, the data is still important, because it has got to continue to help support stocks in the face of ever-dimming policy prospects. So, those numbers (especially durable goods) need to continue to imply economic acceleration.
Other data to watch this week includes housing data (New Homes Sales Wednesday and Existing Home Sales Thursday), but generally housing continues to hold up well in the face of generally higher rates.
The Sevens Report is everything you need to know about the market, in your inbox by 7am each morning, in 7 minutes or less. Get a free trial!


