Six Charts That Explain This Market from the Sevens Report

The Sevens Report is everything you need to know about the markets, in your inbox before 7am, in 7 minutes or less. Sign up now and get a free two-week trial.

Below you’ll find six charts, spanning asset classes and economic data.

The charts are divided up into two groups.

Group 1 is comprised of four charts that explain why stocks have rallied so nicely in 2017, and why, in the near term, the trend in markets is still higher.

Group 2 is comprised of two charts that look into the future, and show that despite a bullish set up right now, there are real, serious reasons to be worried about how long this rally can last. Point being, these indicators are telling you not to be complacent!

Group 1: Why Stocks Have Rallied

Chart 1:  Economic Data 
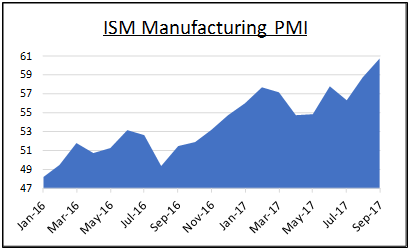
Chart 2:  Earnings Growth  
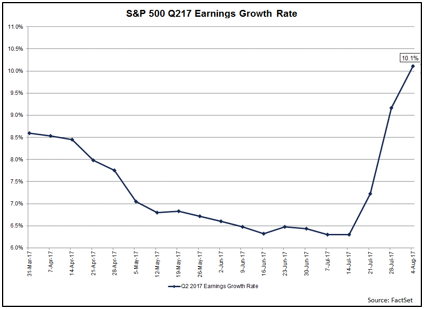
Earnings and Economic Data – The Unsung Heroes of 2017

We have said since the early summer that an acceleration in economic data and earnings growth have been the unsung heroes of the 2017 rally.

And, as long as both of these factors continue to trend higher, that will underpin a continued rise in U.S. stocks, regardless of noise from Washington, North Korea, Russia, etc.

Chart 3:  S&P 500 
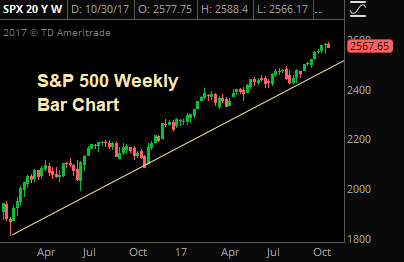
The Trend Is Your Friend

The trend in stocks has been relentlessly higher since early in 2016, and the S&P 500 has held that trend line through multiple tests.

Bottom line, the technical outlook on this market remains powerfully positive.

Chart 4:  Commodities (Oil & Copper)

There are few better indicators of global economic growth than industrial commodities, and two or the most important (oil and copper) have been telling us for months that global growth is accelerating.

And, as long as oil and copper are grinding to new highs, that will be a tailwind not just on U.S. stocks, but on global stocks as well.

Group 2:  Risks to This Rally

While the four charts above explain why stocks have rallied and why the outlook remains, broadly, positive, there are still risks to this rally and this market.

Don’t be fooled into being complacent with risk management, because while trends in U.S. and economic growth, earnings and the stock market are all still higher, there are warning signs looming on the horizon.

Chart 5:  Inflation (Warning Sign #1)
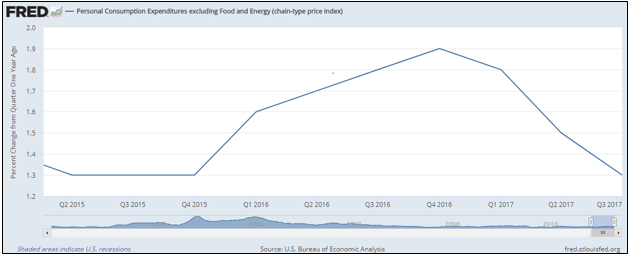
Non-Confirmation: Why Isn’t Inflation Rising?

Inflation remains inexplicably low, considering that we’re near full employment and global economic growth is accelerating.

And, accelerating inflation remains the missing piece of a true “Reflation Rally” that can carry stocks 10%, 15% or even 20% higher over the coming quarters and years.

But, it’s not just about missed opportunity.

The lack of inflation is a big “non-confirmation” signal on this whole 2017 rally, and if we do not see inflation start to rise, and soon, that will be a major warning sign for stocks, because…

Chart 6: The Yield Curve – Will It Invert?
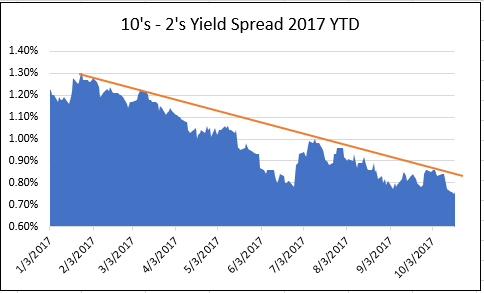
Yield Curve: Sending a Warning Signal? 

If the outlook for stocks is so positive, then why did the yield curve (represented here by the 10’s – 2’s Treasury yield spread) equal 2017 lows on Wednesday?

Simply put, if we’re seeing accelerating economic growth, rising earnings, potential tax cuts and all these other positive market events, the yield curve should be steepening, not flattening.

So, if this 10’s – 2’s spread continues to decline, and turns negative (inverts) then that will be a sign that investors need to begin to exit the stock market, because a serious recession is looming, and the Fed won’t have much ammunition to fight it.

If I was stuck on a desert island (with an internet connection and access to my trading accounts of course) and could only have one indicator to watch to tell me when to reduce exposure in the markets, this 10’s – 2’s spread would be it – and it’s not sending positive signals for 2018!
Reflation Pause- Part 2, October 11, 2017

The Sevens Report is the daily market cheat sheet our subscribers use to keep up on markets, leading indicators, seize opportunities, avoid risks and get more assets. Get a free two-week trial with no obligation, just tell us where to send it.

Reflation Update Part 2—Why This Reflation Is Different

In Wednesday’s Report, we covered why the reflation trade that started again in early September has taken a pause, and the reasons are twofold.

First, the market is unclear about who the next Fed chair will be. If it’s Kevin Warsh, that will be a “hawkish” surprise and rates could rise too quickly to keep this reflation “virtuous.”

Second, it’s unclear if upcoming central bank meetings, which means primarily the ECB but secondarily the Bank of England, will be Goldilocks. If either bank is more hawkish than the market expects it could send global rates sharply higher, causing a
pullback in the broad market.

Conversely, if either bank expresses doubts about growth or inflation, it could undercut the whole reflation idea that’s propelled stocks higher.

Point being, there are some key events that need to be resolved before the reflation trade can move higher. And, frankly, that makes this 2017 version of the reflation trade unique compared to previous economic reflations, most recently from ‘03-’06.

For simplicity, the easiest analogy to describe a normal reflation trade is a beach ball. When a recession occurs, the beach ball (the economy) deflates. But, low interest rates and government stimulus act as an air pump, and eventually the beach ball (economy) reflates.

Accelerating economic growth and rising inflation (due to easy money) are the “air” that inflates our economic beach ball. From a market standpoint, economic reflations are usually wonderful things. Markets go up in concert, and the way to outperform is to add beta and be exposed to cyclical, growth-oriented sectors. During a normal reflation (the last one was in ’03-’06) everything goes up regardless of what else is going on in the world.

However, this reflation is different.

Eight years after the end of the financial crisis, our economic beach ball is only half full. That’s because we’ve pumped in the “air” of accelerating economic growth (GDP going from negative to 2.5%ish) but we haven’t pumped any “air” of inflation in, yet.

Despite that, stocks are at all-time highs. Valuations are as stretched as any of us have seen them in decades. And, now we’re very late in the typical economic cycle.

Given that, barring some big surprise on tax cuts or infrastructure spending, it’s unlikely that we’re going to see a material acceleration of economic growth. In reality, 3.5% – 4% GDP growth is quasi impossible given demographics in this country—specifically the large demographic of baby boomers entering retirement, and them being replaced by a smaller workforce.

Getting back to our beach ball analogy, if inflation finally accelerates there will be a shorter time of euphoria—as the other half of our beach ball inflates. We got a hint of that in September.

But given valuations, stock prices and economic growth all are at or nearing reasonable ceilings, the risk is that after a short bit, the “air” from rising inflation over inflates our economic beach ball, and a bubble (or multiple bubbles) develop and we burst the ball. Practically, what I’m talking about is the Fed hiking rates and inverting the yield curve, which would be our signal that the beginning of the end of this eight-year expansion is now upon us.

From an advisor or investor standpoint, this creates a difficult set up. For now, we must continue to be invested and, potentially, allocate to the reflation sectors. Yet we also must do so knowing that unlike most revelations, we’re not going to enjoy an easy rally that lasts years.

So, the now years-long game of market musical chairs continues, albeit with a potentially reflation accelerating the pace of the music. For shorter or more tactical investors, holding “Reflation Basket” allocations makes sense as we approach and navigate these upcoming events.

For longer-term investors, we continue to await confirmation from the 10-year yield that this reflation truly is upon us. A few closes above the 2.40% level will be the signal, in our opinion, to rotate out of defensive names and into part or all of our Reflation Basket—Banks (KRE/KBE/EUFN), industrials (XLI), small caps (IWM) and inverse bond funds (TBT/TBF).

Bottom line, at this point in the economic cycle, for stocks to move materially higher we need inflation to accelerate and cause that reflation trade, but weneed to realize that brings us one step closer to the ultimate “bursting” of the recovery. This market remains more dangerous over the medium/longer term than the low VIX would imply.

Cut through the noise and understand what’s truly driving markets, as this new political and economic reality evolves. The Sevens Report is the daily market cheat sheet our subscribers use to keep up on markets, seize opportunities, avoid risks and get more assets. Sign up for your free two-week trial today and see the difference 7 minutes can make. 

Reflation Pause, October 20, 2017

The Sevens Report is the daily market cheat sheet our subscribers use to keep up on markets, leading indicators, seize opportunities, avoid risks and get more assets. Get a free two-week trial with no obligation, just tell us where to send it.

Why Is the Reflation Rebound Pausing? Because It Should. Here’s Why…

After surging basically from Sept. 11 through Friday’s jobs report, the reflation rebound has taken a pause for the last few days, and I wanted to provide a comprehensive update of:

1) Where we are in the reflation process and specifically the key catalysts that are looming in the near future and that are causing this pause, and

2) Explain why this reflation trade is different from others, and requires A) A more tactical allocation to get the outperformance we all want, and B) Greater patience on the part of longer-term investors before abandoning what’s worked so well in 2017 and allocating to more reflation-oriented sectors.

Due to space constraints, I’m going to break this up into two parts covered today and tomorrow.

Reflation Update Part 1: Where Are We, and What Will Decide Whether It’s Going to Continue?

We’ve been saying since the July Fed meeting that inflation was now the most important economic statistic, and that markets needed inflation to start to rise to help fuel a “reflation rebound.”

Well, during the week between Sept. 11 and Sept. 15, Chinese, British and US CPIs beat expectations, and combined with an uptick in global economic activity, caused tactical investors to rotate into tactical sectors (banks, energy, industrials, small caps, inverse bond funds).

And, we were early on identifying that switch, and our “Reflation Basket” has outperformed the markets since we re-iterated it for short- and medium-term investors in the Sept. 21 Report.

However, also in that Report we cautioned longer-term and less-agile investors to wait for clear confirmation that the reflation rebound had started, and we identified two keys. The first was the KBW Bank Index closing above 100. This occurred both Monday and Tuesday. The second was the 10-year yield breaking above 2.40%.This has yet to happened.

So, while much of the mainstream financial press is now pumping the reflation trade (a month after it started) we’re acknowledging that it’s paused. Practically, that means we’re holding (not adding to) our “Reflation Basket” of KRE/KBE/IWM/EUFN/XLI/TBT/TBF, and think shorter-term/tactical investors should too.

I say that because I believe the first stage of this reflation trade is now complete, and in the next three weeks we will see two key events that will decide whether this reflation extends into November, pauses longer or potentially back tracks.

Near-Term Reflation Catalyst #1: ECB Meeting. Thursday, Oct. 26. Why it’s Important: As we’ve covered, markets have enjoyed a “virtuous” reflation recently because 1) Economic data has been good, but 2) Not so good that it’s causing global central banks to hike rates faster than expected.

Markets have a general expectation of what ECB tapering of QE will look like (somewhere around 20B per month) but we’ll get the details at this October ECB meeting.

If the ECB is more hawkish than expected, that could potentially send yields too high, too fast, and kill the
“virtuous” reflation. If that happened, banks and inverse bond ETFs would rally, but everything else would fall.

Conversely, if the ECB is too dovish, then markets might lose confidence in the reflation itself, and that would become a headwind.

Bottom line, the ECB needs to release a taper schedule that implies confidence in the economy and inflation, but that also isn’t so aggressive it kills the “virtuous” reflation rally.

Near-Term Reflation Catalyst #2: Fed Chair Decision.
The fact that President Trump will name a potentially new Fed chair in the next two weeks has been somewhat lost amidst the never-ending (and seemingly everescalating) Washington drama.

Right now, it’s widely believed there are three front runners: Kevin Warsh, Jerome Powell and Janet Yellen.

If Yellen is reappointed (and that’s seeming increasingly unlikely) then clearly that won’t cause any ripples in the reflation trade, and we can go back to watching inflation and yields. However, if one of the other two are appointed, things get interesting.

Warsh is considered the biggest “hawk” of the group,and if he becomes Fed chair we may see yields rise sharply, potentially endangering the “virtuous” reflation.

Powell is viewed as in the middle of the other two—not as dovish as Yellen, but not as hawkish as Warsh. But, it’s reasonable to assume that a Powell appointment would put at least some mild upward pressure on Treasury yields. It likely wouldn’t be enough to spur a killing of the “virtuous” reflation, but it would be cause for a pause in the move.

Cut through the noise and understand what’s truly driving markets, as this new political and economic reality evolves. The Sevens Report is the daily market cheat sheet our subscribers use to keep up on markets, seize opportunities, avoid risks and get more assets. Sign up for your free two-week trial today and see the difference 7 minutes can make. 

Should We Buy Value to Get Growth?, October 3, 2017

The Sevens Report is the daily market cheat sheet our subscribers use to keep up on markets, leading indicators, seize opportunities, avoid risks and get more assets. Get a free two-week trial with no obligation, just tell us where to send it.

At the start of 2017, I incorrectly expected growth sectors of the market to outperform, as I anticipated inflation and economic data to steadily improve as the Fed continued to hike rates.

The latter expectation (Fed rate hikes) has been met, but the former two, until now, have not, as the dip in inflation and growth caused a drop in bond yields and resulted in the outperformance of defensive sectors (not growth/cyclical sectors) so far in 2017.

But things appear to be changing, and while past performance is no guarantee of future results, if we are on the cusp of a “reflationary” rally, then history suggests buying “value” funds will be the way to outperform into year-end.

On the surface, though, this doesn’t make sense. If we are going to see a reflation, won’t “growth” styles naturally outperform given the acceleration in inflation/economic activity?

The answer is “yes,” but here’s the rub: Growth-oriented sectors like banks and energy have massively underperformed this year and are now heavily owned by most value-styled ETFs. Meanwhile, growth-styled ETFs are heavily overweight tech, and stand to underperform in a reflation, just like they did in 2016.

The key here lies in the fund’s sector allocations.

My favorite “growth sector” ETF is actually the iShares S&P 500 Value ETF (IVE), which is allocated as follows: 28% financials, 12% healthcare, 11% energy. So, 40% of the ETF is weighed to sectors (financials and energy) that will surge in a reflationary rally. Conversely, utilities are just 6%, tech is 7% and consumer staples are weighted at 11%.

Up until September, this weighting has caused IVE to lag the S&P 500, but IVE rallied 2.7% in September, more than doubling the S&P 500. Looking further back, in the pro-growth, post-election rally between Nov. 8 and year-end 2016, IVE surged 17% compared to just 9% for the S&P 500.

Point being, lackluster inflation and economic readings in 2017 have created a scenario where outperforming sectors are predominantly “defensive” sectors. But, this big rally has caused these sectors (utilities, staples, super-cap tech) to be significantly underweighted in some value ETFs and mutual funds—and that creates this weird  set up where getting exposure to growth sectors that can outperform in an economic reflation means buying “value” ETFs and mutual funds due to their recent underperformance.

So, as we start the fourth quarter, if you’re reviewing client exposure, don’t forget that “value” funds, if we see a confirmed economic reflation, will provide the exposure to growth sectors we need to outperform.

Food for thought.

Cut through the noise and understand what’s truly driving markets, as this new political and economic reality evolves. The Sevens Report is the daily market cheat sheet our subscribers use to keep up on markets, seize opportunities, avoid risks and get more assets. Sign up for your free two-week trial today and see the difference 7 minutes can make. 

When Will Rate Hikes Kill The Rally?

The Sevens Report is the daily market cheat sheet our subscribers use to keep up on markets, leading indicators, seize opportunities, avoid risks and get more assets. Get a free two-week trial with no obligation, just tell us where to send it.

When Will the Fed Kill the Bull Market? (Or, What is the Neutral Fed Funds Rate?)

A lot of clichés on Wall Street aren’t worth the paper they’re printed on, but one saying I have found to be  quite accurate is: Bull Markets Don’t Die From Old Age. It’s the Fed that Kills Them.

At least over the last 20 years, that has largely proven true. The general script goes like this:

First, the Fed starts raising rates because financial conditions have become too easy (this should sound familiar). In this cycle, rate hikes began in December 2015 but importantly, they are starting to accelerate.

Second, those rate hikes cause the yield curve to invert. That happens as bond investors sell short-term Treasuries and send short-term yields higher (because the Fed is raising short-term rates), and buy longer-dated Treasuries, pushing those yields lower, because investors know the rate hikes will eventually cut off economic activity. In this cycle, the yield curve hasn’t inverted yet, but the 10s—2s Treasury yield spread has fallen from over 2% in late-2014 to fresh, multi-year lows at 0.77% (as of Sept. 5).

Third, the inversion of the yield curve is a loud-and-clear “last call” on the bull market. The rally doesn’t end when the curve inverts, but it’s a clear sign that the end is much closer to the beginning. In this cycle: We are not at that inversion step yet, although we are getting uncomfortably close.

Fourth, after the curve inverts, the Fed keeps hiking rates until economic momentum is halted. During the last two economic downturns (2001/2002 and 2008/2009) the Fed was able to hike rates to 6.5% and 5.25%, respectively, before effectively killing the bull market.

But just as the Fed continues to cut rates after the economy has bottomed, it also hikes rates after economic growth has stalled (because of the lag time between rate hikes and the effect on the economy).

So, it’s reasonable to assume the actual Fed Funds rate level which caused the slowdown/bear market is at least 25 to 50 basis points below those high yields, so 6% or 6.25% in ’01/’02 and 4.75% or 5% in ’08/’09.

In this cycle, the most important question we can ask is: At what level of rates does the Fed kill the expansion and the rally? That number, which the Fed calls the “neutral” Fed Funds rate is thought to be somewhere between 2.5% and 3% this time around (at least according to Fed projections).

However, we’ve never come out of a cycle where we’ve had:
1. Four separate rounds of QE

2. The maintaining of a multi-trillion dollar balance sheet

3. Eight-plus years of basically 0% interest rates

4. Eight-plus years of sub-3% GDP growth

So, common sense would tell us that this “neutral” Fed funds rate is going to be much, much lower than it’s been in the past.

How much lower remains the critical question (2.5%? 2.0%? 1.5?)

This is really important, because if the answer is 1.5%, we’re going to hit that early next year (it likely isn’t 1.5%, but it may not be much higher).

And, what impact will balance sheet reduction have on this neutral rate?

Again, common sense would tell us that balance sheet reduction makes the neutral rate lower than in the past, because balance sheet reduction is a form of policy tightening that will go on while rates are rising (so it’s a double tightening whammy).

There are two important takeaways from this analysis.

First, while clearly the tone of this analysis is cautious, it’s important to realize that the yield curve has not inverted yet, so we haven’t heard that definitive “last call” on the rally. And, just like at an actual last call, there’s still some time and momentum left afterwards, so an inverted curve is a signal to get ready to reduce exposure, not a signal to do so that minute.

Second, on a longer-term basis, if the Fed really is serious about hiking rates, then this bull market is coming to an end, and the risk is for it happening sooner rather than later. Because the level at which rate hikes cause a slowdown and kill the bull market is likely to be much, much lower than anything we’ve seen before (unless there is a big uptick in economic activity).

That is why I said yesterday that if the Fed is serious about consistently hiking rates going forward, that the “hourglass” may have finally been flipped on the bull run. So, while hitting that “Neutral” Fed funds rate Is hopefully at least a few quarters away (unless things are way worse than we think) it’s my job to watch for these types of tectonic shifts in the market so that we’re all prepared to act when the time is right. We will be watching this closely.

Cut through the noise and understand what’s truly driving markets, as this new political and economic reality evolves. The Sevens Report is the daily market cheat sheet our subscribers use to keep up on markets, seize opportunities, avoid risks and get more assets. Sign up for your free two-week trial today and see the difference 7 minutes can make. 

FOMC Preview, September 19, 2017

The Sevens Report is the daily market cheat sheet our subscribers use to keep up on markets, leading indicators, seize opportunities, avoid risks and get more assets. Get a free two-week trial with no obligation, just tell us where to send it.

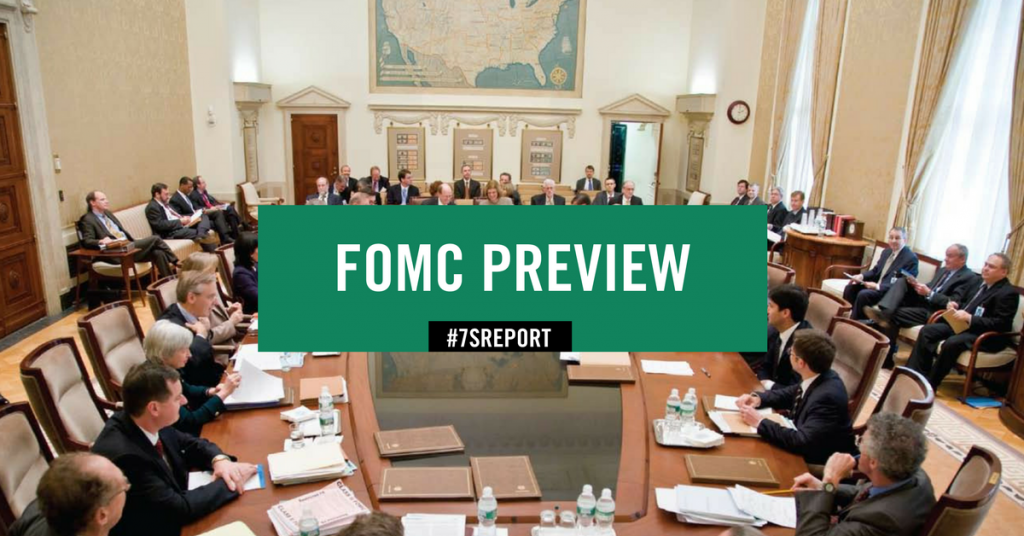
On the surface, tomorrow’s FOMC meeting is expected to be relatively anti-climactic. The Fed is expected to go forward with balance sheet reduction while keeping interest rates unchanged. But, this is a meeting where the Fed will produce updated “dots,” and combined with the fact that the market is very complacent with regards to a December rate hike (i.e. the market doesn’t expect it) there is the chance for a hawkish surprise.

From a practical standpoint, the key here is how the 10- year yield reacts. If the Fed is marginally (or outright)  hawkish and the 10-year yield pushes through short-term resistance at 2.27% and longer-term resistance at 2.40%, that could be a tactical game changer and warrant profit taking in defensive sectors, and rotation to more cyclical sectors.

Hawkish If: The Fed provides a (very) mildly hawkish surprise if the “dots” show one more rate hike in 2017 (so unchanged from June). Specifically, in June four Fed votes expected just two rate hikes in 2017. If that number decreases to three or two, it will be a mild hawkish surprise. The Fed will provide a more serious hawkish surprise if the dots show another rate hike in ’17 and an additional rate hike in 2018 (so the median dots staying at 1.375% for ’17 and rising to 2.375% from the current 2.125% in ’18).

Likely Market Reaction. Stocks: If it’s a mildly hawkish surprise, then it should…(withheld for subscribers only—unlock specifics and ETFs by signing up for a free two-week trial).

Meets Expectations If: There are no changes. The median dots still signal a December rate hike is expected, but one or two Fed officials change their dot to reflect just two rate hikes in 2017. That would imply a December rate hike is far from certain (matching the market’s current expectation) and it would be taken as mildly dovish.

Likely Market Reaction. Stocks: Cyclicals and bank stocks would likely see some…(withheld for subscribers only—unlock specifics and ETFs by signing up for a free two-week trial).

Dovish If: The dots show that more than four Fed voters switch their dot to reflect no rate hike in December. That would effectively put a December rate hike off the table.

Likely Market Reaction. Stocks: A decidedly week (on a sector level). Stocks would likely rally in an
algo-driven…(withheld for subscribers only—unlock specifics and ETFs by signing up for a free two-week trial).

Wildcard to Watch: Balance sheet reduction. Everyone expects the Fed to commence balance sheet reduction tomorrow, but they haven’t ever explicitly said they will reduce the balance sheet in September. So, there is a slim chance they might not, and that they might opt to wait for the next meeting (in November). This is a remote chance, as the Fed has clearly telegraphed the balance sheet will be reduced in September, but it’s possible for a last-minute change.

Likely Market Reaction: Very dovish…(withheld for subscribers only—unlock specifics and ETFs by signing up for a free two-week trial).

In all likelihood, this Fed meeting should meet expectations, but that will leave the market at risk to a potential hawkish surprise later as investors are not pricing in a December rate hike despite the Fed signaling it all year.

Cut through the noise and understand what’s truly driving markets, as this new political and economic reality evolves. The Sevens Report is the daily market cheat sheet our subscribers use to keep up on markets, seize opportunities, avoid risks and get more assets. Sign up for your free two-week trial today and see the difference 7 minutes can make. 

Taxes Update, August 23, 2017

The Sevens Report is everything you need to know about the markets in your inbox by 7am, in 7 minutes or less. Start your free two-week trial today and see what a difference the Sevens Report can make.

What a difference a few days can make. By Thursday’s close, the S&P 500 was at a one-month low, and the prospects for any tax cuts or foreign profit repatriation tax holiday were dim.

Now, thanks to one Politico article, happy days are here  again, as the S&P 500 surged on the idea that the leaders in Washington are actually making progress on tax cuts! Hopefully, you can sense my sarcasm.

The lack of liquidity and attendance in the market is making these tax-related market mood swings worse than they otherwise should be, so I wanted to step back and provide a clear, unemotional update on the tax cut situation.

Starting with Tuesday’s Politico article, there were two reasons it was positive: The “Big Six,” and 22% to 25%. Starting with the latter, you know from this Report that right now, the market is expecting a corporate tax cut in Q1 2018 down to 28%. If that happens, it likely isn’t a materially positive or negative catalyst.

However, the Politico article implied consensus was coalescing around a corporate rate between 22% and 25%, obviously less than 28%. If that happens, it will represent a positive catalyst and a boost to corporate earnings, which will send stocks higher.

Now, on to the former. The “Big Six” is apparently the nickname that a key group of Republican leaders have given themselves in regards to tax negotiations. For clarity, the “Big Six” are: Treasury Secretary Mnuchin, National Economic Council Director Cohn, Senate Majority Leader McConnell, Speaker of the House Ryan, House Ways and Means Committee Chair Brady, and Senate Finance Committee Chair Hatch.

The Politico article implied the “Big Six” have been working much closer than previously thought, and that they have made a lot more progress on the structure of tax cuts (although plenty of details remain).

Bottom Line
The noise on this topic is officially deafening, but I want to cut through it and give you some hard takeaways on the outlook for tax cuts and the impact on the market.

1. Expect more tax-related volatility. If January through August is any guide, we can expect the ever-growing Washington soap opera to fully engulf the tax cut issue this fall. Like healthcare, there are multiple moving pieces, a lot of important, TV happy players (I’m not even including Trump), and a lot of pressure—as this is basically the Republicans’ last chance to get any legislative priorities accomplished before focus on the midterms starts in 2018.

2. The outlook for tax cuts wasn’t as bad as it seemed last Thursday, and it’s not as good as it seems right
now. The Politico article was positive, but it didn’t contain anything ground breaking. To boot, it appears that substantially controversial issues are being discussed in the tax cut package, including: Capping mortgage interest deductions, eliminating the deduction of state and local taxes against federal, corporate interest deductibility and other issues. These and foundational pieces of the current tax code, and removing them won’t be easy.

3. The sector winners from potential tax cuts remain the same as they’ve been all year: Super-cap tech (on foreign profit repatriation), healthcare (on foreign profit repatriation), retailers (they pay high corporate taxes) and oil and gas (high tax rates). FDN/QQQ, XLV/IBB/IHF, RTH and XLE/XOP are all ETFs that
should outperform if taxes surprise to the upside.

4. A prediction: Tax cuts happen in Q1 2018. I’m in the business of generating conclusions and opinions, so I’ll give one about this tax issue. I’d give it about a 65% chance that tax cuts/foreign repatriation holiday gets done by Q1 2018, and about a 50/50 chance those tax cuts positively surprise (i.e. the corporate rate drops below 28%). I do not expect any changes to personal taxes. The reason for this opinion, as I’ve said several times before, is self-preservation. Congressional Republicans are on the ballot in 2018, President Trump is not. If they fail to accomplish anything (no healthcare repeal, no tax cuts) and this Washington soap opera continues, then it’ll be Congressional Republicans who are out of a job. So, they have to get something done if they want to save their jobs. There’s no better predicator of action in Washington than the rule of self-preservation.

Time is money. Spend more time making money and less time researching markets every day.

Why the Phillips Curve Matters to You, August 8, 2017

The Sevens Report is everything you need to know about the markets in your inbox by 7am, in 7 minutes or less. Start your free two-week trial today and see what a difference the Sevens Report can make.

Pushing unemployment lower should, eventually, cause inflation—unless this entire theory (upon which most of monetary policy is based) is incorrect.

Pushing unemployment lower should, eventually, cause inflation—unless this entire theory (upon which most of monetary policy is based) is incorrect.

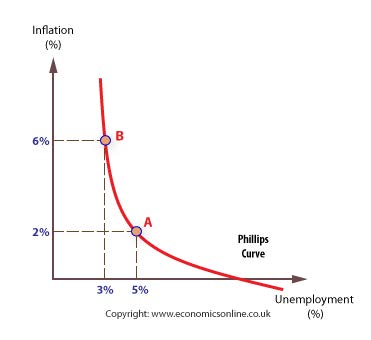
The Phillips curve is a term you’re likely seeing and hearing more recently than at any time previously in your career (regardless of how long it is). The reason the Phillips curve is being discussed so much is simple: There’s a growing school of thought that thinks the Phillips curve is broken, and if that’s the case, then the Fed and other central banks may be largely powerless to spur inflation (which is a potential negative for the broad markets).

Before we get into this issue, though, first lets get a bit of background on the Phillips curve. Basically, the Phillips curve is just a graph of this simple idea: Low unemployment creates higher inflation.

From a commonsense standpoint, it is logical. Less available workers and robust business activity (so low supply and high demand for workers) will cause salaries (the “price” of a worker) to rise, and that in turn will flow through to the entire economy and spur price inflation.

So, put simply, the Phillips curve says low unemployment will spur inflation. And, this idea has been the cornerstone of Fed policy for decades and largely explains the Fed’s strategy post financial crisis.

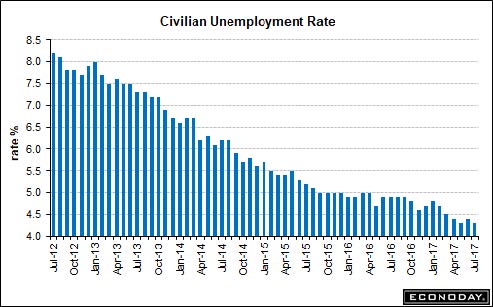
Plunging unemployment: At some point, this must create inflation, or at least that’s what Yellen believes.

Plunging unemployment: At some point, this must create inflation, or at least that’s what Yellen believes.

But, there’s a small problem: It doesn’t appear to be working in today’s economy, as historically low unemployment is failing to spur inflation.

Now, this may seem like a theoretical, academic conversation, but it has real, near-term market consequences.

For instance, the entire mid-July rally in stocks came because the Fed began to note low inflation more than low unemployment.

That caused the decline in Treasury yields and exacerbated the drop in the dollar—and that helped spur a rally in stocks.

However, that may have changed with Friday’s jobs report. The unemployment rate hit 4.3%, matching a fresh low for this expansion (i.e. since the financial crisis). And, unemployment that low will get the Fed’s attention (at least Yellen’s attention) because while there is a debate about the Phillips curve still being accurate, the bottom line is that the Fed still follows it. At some point, if unemployment continues to drop, the Fed will have to continue with rate increases regardless of what’s happening with inflation.

And, that could have an important impact on returns and performance.

Here’s why: If unemployment grinds towards 4% or below, the Fed will have to get hawkish or either 1) Abandon decades of monetary policy that has largely worked, or 2) Risk a significant rise in inflation down the road (according to the Phillips curve) that would require a sharp, painful increase in interest rates—a move that almost certainly would put the US economy into recession.

The practical investment takeaways are this: (withheld for subscribers of the 7sReport—sign up for your free two-week trial to unlock). 

Is the Earnings Rally Losing Steam?

Join hundreds of advisors from huge brokerage firms like Morgan Stanley, Merrill Lynch, Wells Fargo Advisors, Raymond James and more… see if The Sevens Report is right for you with a free two-week trial.

Earnings have been an unsung hero of the 2017 rally, but there are some anecdotal signs that strong earnings may already be fully priced into stocks, leaving a lack of potential positive catalysts given the macro environment.

Now, to be clear, earnings season has been (on the surface) good. From a broad standpoint, the results have pushed expected 2018 S&P 500 EPS slightly higher (to $139) and that’s enough to justify current valuations, taken in the context of a calm macro horizon and still-low bond yields.

However, the market’s reaction to strong earnings is sending some caution signals throughout the investor
community. Specifically, according to a BAML report I read earlier this week, the vast majority of companies who reported a beat on the top line (revenues) and bottom line (earnings) saw virtually no post-earnings rally this quarter. Getting specific, by the published date of the report (earlier this week) 174 S&P 500 companies had beat on the top and bottom line, yet the average gain for those stocks 24 hours after the announcement was… 0%. They were flat. To boot, five days after the results, on average these 174 companies had underperformed the market!

That’s in stark contrast to the 1.6%, 24-hour gain that companies who beat on the revenues and earnings have enjoyed, on average, since 2000.

In fact, the last time we saw this type of post earnings/sales beat non-reaction was Q2 of 2000. It could be random, but that’s not exactly the best reference point.

So, if we’re facing a market that’s fully priced in strong earnings, the important question then becomes, what will spur even more earnings growth?

Potential answers are: 1) A rising tide of economic activity, although that’s not currently happening. Another is 2) A surge in productivity that increases the bottom line. But, productivity growth has been elusive for nearly a decade, and it’s unclear what would suddenly spark a revival. Finally, another candidate is 3) Rising inflation that would allow for price and margin increases. Yet as we know, that’s not exactly threatening right now, either.

Bottom line, earnings have been the unsung hero of this market throughout 2017, but this is a, “What Have You Don’t For Me Lately” market, especially at nearly 18X next year’s earnings. If earnings growth begins to slow and we don’t get any uptick in economic growth or pro-growth policies from Washington, then it’s hard to see what will push this market higher beyond just general momentum (and general momentum may be fading, at least according to the price action in tech). To be clear, the trend in stocks is still higher, but the environment isn’t as benign as sentiment, the VIX or the financial media would have you believe.

Time is money. Spend more time making money and less time researching markets every day—start your free trial of the Sevens Report now.

Are Banks About to Break Out?

Join hundreds of advisors from huge brokerage firms like Morgan Stanley, Merrill Lynch, Wells Fargo Advisors, Raymond James and more… see if The Sevens Report is right for you with a free two-week trial.

Banks were again the highlight, as BKX rose 0.83%, and that pulled the Financials SPDR (XLF) up 0.72%. The bank stock strength came despite the decline in yields, which we think is notable. In fact, over the past several trading days, bank stock performance has decoupled from the daily gyrations of Treasury yields, and we think that potentially signals two important events.

Regardless, this price action in banks is potentially important, because this market must be led higher by either tech or banks/financials. If the former is faltering (and I’m not saying it is), then the latter must assume a leadership role in order for this really to continue.First, it implies bank investors are starting to focus on the value in the sector and on the capital return plans from banks, which could boost total return. Second, it potentially implies that investors aren’t fearing a renewed plunge in Treasury yields (if right, that could be a positive for the markets).

Bottom Line

This remains a market broadly in search of a catalyst, but absent any news, the path of least resistance remains higher, buoyed by an incrementally dovish Fed, solid earnings growth, and ok (if unimpressive) economic data.

Nonetheless, complacency, represented via a low VIX, remains on the rise, and markets are still stretched by any valuation metric. Barring an uptick in economic growth or inflation, it remains unclear what will power stocks materially higher from here. For now, the trend remains higher.

Time is money. Spend more time making money and less time researching markets every day—start your free trial of the Sevens Report now.