Is Impeachment a Negative for Markets?
What’s in Today’s Report:
- What Impeachment Means for Markets
- Economic Breaker Panel September Update
Stock futures are extending losses this morning and international equity markets were broadly lower overnight as political and trade uncertainties weigh on sentiment.
Speaker of the House, Nancy Pelosi, formally announced an impeachment inquiry regarding President Trump’s interactions with the President of Ukraine which has added to an already crowded list of potential market headwinds.
Otherwise, it was a relatively quiet night of news with no material economic data releases and no trade war developments.
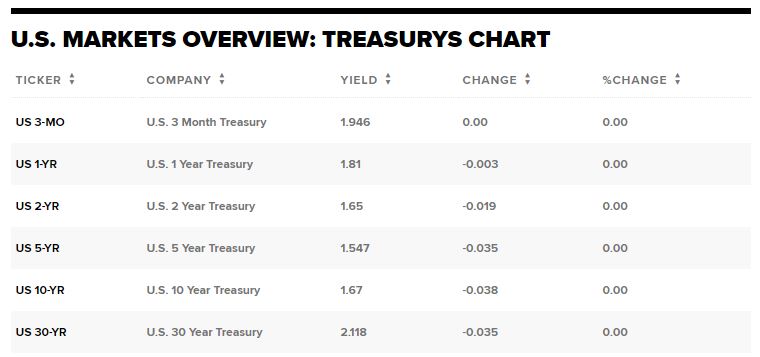
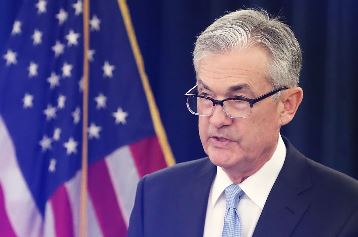
Today, there is one economic report to watch: New Home Sales (E: 665K) and a relatively busy schedule of Fed speakers: Evans (8:00 a.m. ET), George (10:00 a.m. ET), and Kaplan (7:00 p.m. ET). There is also a 5-Yr Treasury Note Auction at 1:00 p.m. ET and based on yesterday’s very solid 2-Yr Auction that helped steepen the yield curve, the results could once again influence the stock market.
Beyond those scheduled market catalysts, investors will be focused on the fluid impeachment situation as well as sensitive to any trade war developments.