Posts

Last Week and This Week in Economics, April 17, 2017

Week of April 17th and April 10th in Economics

Last Week in Economics – 4.10.17

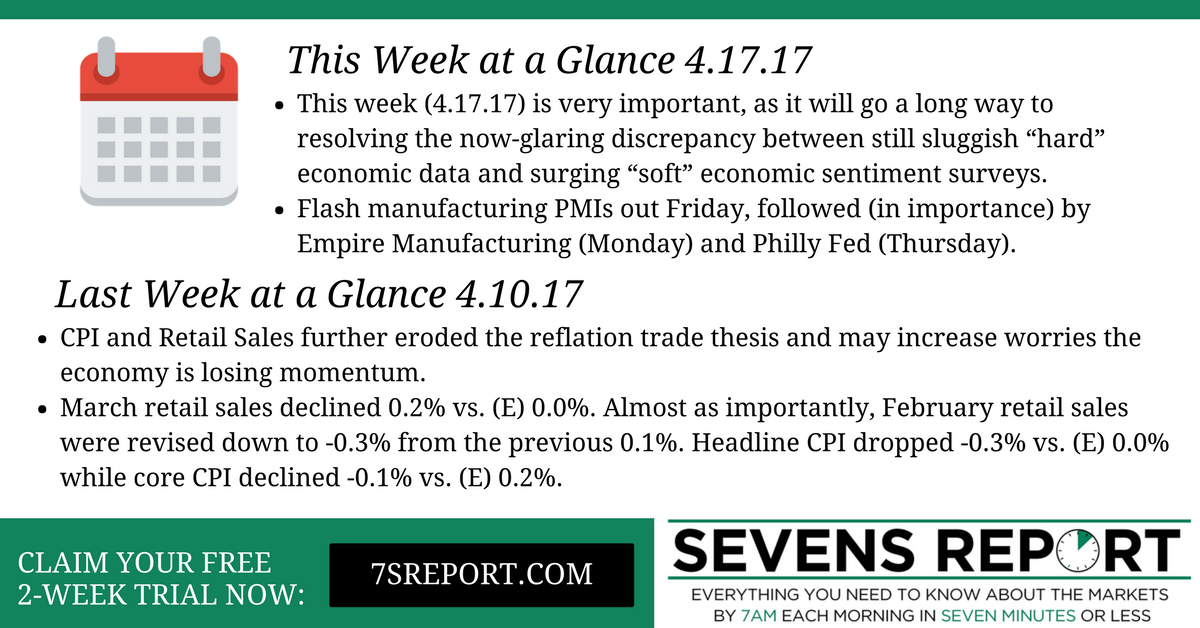
The two important economic numbers came out Friday when markets were closed, so they didn’t receive much attention, although they should have. Both numbers (CPI and Retail Sales) further eroded the reflation trade thesis and will increase worries the economy is losing momentum.

Starting with retail sales, the headline on this number was plain ugly. March retail sales declined 0.2% vs. (E) 0.0%. Almost as importantly, February retail sales were revised down to -0.3% from the previous 0.1%. As longer-term readers know, we generally disregard the headline and instead look at the “control” group retail sales, which is retail sales ex autos, gasoline and building materials. That control group gives us a better read on truly discretionary spending.

Here the numbers are a bit better. Control retail sales rose 0.5% in March vs. (E) 0.3%, but February was revised lower from 0.1% to -0.2%. So, considering revisions, the March number wasn’t a beat.

Bottom line, this number is not good for stocks. Consumer spending was the engine powering the Q3/Q4 2016 economic acceleration, and the sluggishness in consumer spending now is extending beyond what we would consider normal slack following a big acceleration. These are not the kind of numbers we would see if a bigger economic acceleration is looming.

Turning to CPI, it also undermined the “reflation” trade in the near term. Headline CPI dropped -0.3% vs. (E) 0.0% while core CPI declined -0.1% vs. (E) 0.2%. Additionally, the year-over-year core CPI reading dipped from 2.3% in Feb. to 2.0% in March. This soft CPI reading isn’t a damning number, and clearly the trend of inflation is higher. Yet markets need modestly higher inflation and better growth to power stocks higher, and last week’s numbers did not suggest that’s happening.

Bottom line, this week now is very important, as it will go a long way to resolving the now-glaring discrepancy between still sluggish “hard” economic data and surging “soft” economic sentiment surveys.

Finally, to make this a bit more real, Friday’s numbers resulted in the GDP Now for Q1 dropping to just 0.5%. That type of economic growth simply cannot support stocks at these levels, and as such we should expect Friday’s data to further pressure bond yields and the dollar, which will increase stock headwinds.

This Week in Economics – 4.17.17

This week is important for markets because we will get a much more definitive answer to the question of whether the pace of economic growth is losing momentum. How that question is answered will go a long way to determining whether the S&P 500 takes out the March low of 2322, or if stocks can bounce.

To that point, the most important economic releases this week all contain March data, and the most important report will be the flash manufacturing PMIs out Friday, followed (in importance) by Empire Manufacturing (today) and Philly Fed (Thursday). The reason those numbers are so important is because it’s April data, so they will give us the most current view of the pace of economic activity in the US. If they further imply there is a loss of momentum, that will further undermine the reflation trade and hit stocks. Conversely, markets need strong data this week to help reinvigorate the reflation trade thesis.

Looking beyond those March data points, the next most important report this week is March Industrial Production. This number is important because a wide gulf still exists between “soft” sentiment -based data, and “hard” economic numbers. Industrial production is the next opportunity for some of that “hard” economic data to move higher and begin to close that gap.

Bottom line, we’re coming to a head on the debate over soft vs. hard economic data, and whether the recent economic acceleration can last. While there aren’t a lot of numbers this week, what data we do get is important to resolving that debate… and that will move markets.

The Sevens Report is the daily market cheat sheet our subscribers use to keep up on markets, seize opportunities, avoid risks and get more assets.

Last Week and This Week in Economics, April 10, 2017

Last Week in Economics – 4.3.17

Signs of a slight loss of economic momentum continued last week, and while on an absolute level growth remains “fine,” stocks need consistently better data to off-set lack of action in Washington, and that’s simply not happening right now. As a result, stocks are “stuck” at the current levels and downside pressures are building.

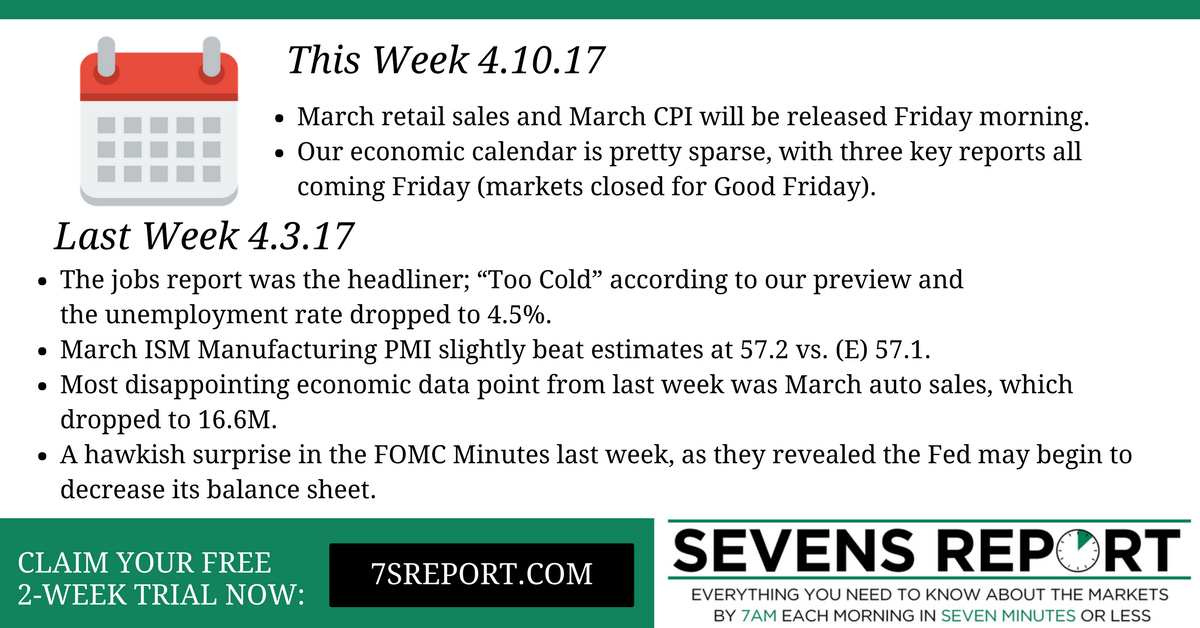
Looking at the notable data releases last week, the jobs report was the headliner and it was “Too Cold” according to our preview. March job adds were 98k vs. (E) 175k while wages grew just 0.2% vs. (E) 0.3%. But, the unemployment rate dropped to 4.5%, which tempered the negative fallout and helped stocks shrug off the soft data.

The other two important numbers from last week were mixed. March ISM Manufacturing PMI slightly beat estimates at 57.2 vs. (E) 57.1. However, it declined from the February 57.7. Additionally, new orders, the leading indicator in the report, dipped to 64.5 vs. (E) 65.1.

March Non-Manufacturing PMI missed estimates at 55.2 vs. (E) 57.0, surprisingly hitting a five-month low. New Orders also dropped to 58.9 from 61.2 and employment plunged to a seven-month low at 51.6.

Looking at these PMIs, they’re a great reflection of the current economic data/market dynamic. On an absolute level, the data is strong (remember any-thing above 50 is expansion). But, incrementally we are not seeing improvement, and as such these data points are not helping power stocks higher like they were in Jan/Feb.

Finally, the most disappointing economic data point from last week was March auto sales, which dropped to 16.6M (seasonally adjusted annual rate, or saar) vs. (E) 17.4M saar. That number weighed on stocks last Monday, as worries about the car market and industry continue to quietly grow.

Turning to the Fed, there was a hawkish surprise in the FOMC Minutes last week, as they revealed the Fed may begin to decrease its balance sheet (i.e. buy less mortgage-back securities and Treasuries) later in 2017. Markets reacted hawkishly when this news hit on Wednesday (dollar up, bond yields up, stocks down) as this was a legitimate surprise (no one expected the balance sheet to start to shrink until 2018).

This is a potentially significant event, and it’s something we’re going to be detailing more this week, as any balance sheet reduction will increase upward pressure on bond yields. As we said last week, this was the first true surprise of 2017.

This Week in Economics – 4.10.17

As is usually the case following a jobs report week, the economic calendar is pretty sparse, with the three key reports all coming Friday (which is Good Friday, and markets will be closed).

March retail sales and March CPI will be released Friday morning. Retail sales is important because it’s the first opportunity for “hard” March data to move higher and meet surging sentiment indicators. A beat by retail sales would be a positive for the market and imply actual economic activity is starting to close the gap on sentiment surveys.

CPI is important because of the reflation trade. The market is pricing in rising inflation and better growth, so this CPI number needs to be Goldilocks. It has to be strong enough to show that inflation is consistent, but at the same time it can’t surge so much that it makes the Fed hawkish (an unlikely scenario).

Bottom line, if Retail Sales and CPI can show 1) Better growth and 2) Steady but not accelerating inflation, it’ll help offset the recent mild data disappointments and be a net positive for stocks.

FOMC Takeaways, March 17, 2017

Linda Yellen

The FOMC raised the fed funds rate 25 basis points, as expected.

The FOMC raised the fed funds rate 25 basis points, as expected.

Below is an excerpt from the full Sevens Report, focusing on the takeaways from the March 15, 2017 Fed meeting. The Sevens Report is everything you need to know about the markets in your inbox by 7am in 7 minutes or less. Sign up for a free 2-week trial today!

Takeaway

The results of this meeting largely met our “What’s Expected,” scenario, as the Fed did hike 25 basis points, but the median “dots” for the number of hikes in 2017 and 2018 were unchanged at three in each year.

So, the Fed generally met well-telegraphed expectations, and the market took it dovishly (as you’d expect). Futures doubled their pre-Fed gains while the dollar dropped sharply and bonds rallied.

Yet, despite the initial moves, I don’t see Thursday’s Fed decision as a bullish game changer, simply because unless we get a surprise downturn in economic data (which won’t be good for stocks), risk still remains for more rate hikes going forward.

So despite the somewhat confusing Fed tactic of rushing to hike in March, only to keep the statement and projections dovish, I’m sticking with my expected market reactions… Stocks rallied, but this isn’t a bullish game-changer; bond yields dropped but it’s likely not a reversal in the uptrend in yields (same for the dollar), and gold rallied and while we may not see a sustained rally just yet, the outlook is becoming more favorable.

Going forward, the market still expects two more hikes in 2017, with June being a close call.

CPI

  • February CPI rose 0.1%, meeting expectations.
  • Core CPI rose 0.2%, also meeting expectations

Takeaway

CPI inflation data largely met expectations on March 15th and the numbers likely didn’t have any effect on the FOMC decision. However, the important point here is that PPI and CPI both confirmed inflation pressures continue to build. Case in point, the year-over-year headline CPI rose to 2.7%, which is a five-year high, while core rose to 2.2%, above the Fed’s stated 2% goal.

From a practical investment management standpoint, this continues to underscore the need for investors to make sure they are positively skewed to inflation for medium- and longer-term accounts (i.e. more equity exposure, reduced long-term bond exposure, TIPS exposure, select hard asset exposure).

Retail Sales

  • February retail sales rose 0.1%, meeting expectations.

Takeaway

There was some noise to cut through in this report, because while the headline met expectations, the more important “control” group (retail sales less autos, gas and building materials) rose just 0.1% vs. (E) 0.3%.

Again, we and others look at the control group because it’s the best measure of discretionary consumer spending. And while that number did miss estimates, the January data saw a big, positive revision, as the control group went from up 0.4% in January to 0.8%. All in all, the numbers were basically in line.

From a market standpoint, this retail sales number still leaves a large and uncomfortable gap between sentiment data (like the Empire Manufacturing Survey and PMIs, which are very strong) and actual, hard data.

Case in point, the Atlanta Fed GDP Now estimate for Q1 GDP fell to 0.9%—hardly robust growth.

Yes, for now the expectation of better growth is off-setting lackluster hard data, but at some point the hard data needs to start to reflect these high sentiment surveys.

This FOMC review is part of the full Sevens Report. For a monthly cost of less than one client lunch, we firmly believe we offer the best value in the independent research space—and you can get two weeks free by signing up for our trial version. Try it today and see what a difference the Sevens Report can make for you every morning.