Posts

Last Week and This Week in Economics, May 1, 2017

The Sevens Report is everything you need to know about the markets by 7am each morning in seven minutes or less. Free trial at 7sReport.com.

Economic data continued to underwhelm last week and the gap between soft sentiment surveys and actual, hard economic data remains wide, and that gap remains a medium term risk on the markets.
The Sevens Report - This week and last week

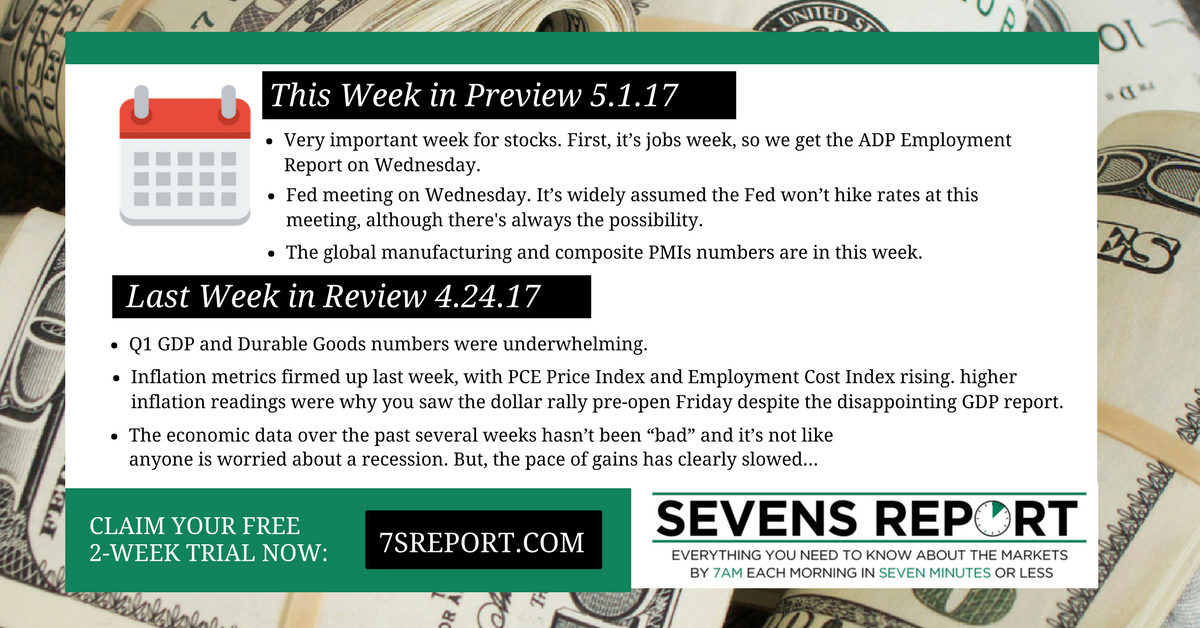
Last week in Economics – 4.24.17

Looking at the headliner from last week, Q1 GDP, it was underwhelming, as expected. Headline GDP was just 0.7% vs. (E) 1.1%, and consumer spending (known as Personal Consumption Expenditures or PCE) rose a mea-sly 0.3%. But, the 0.7% headline met the soft whisper number and that’s why stocks didn’t fall hard on Friday.

That GDP report came on the heels of another underwhelming Durable Goods number. The headline missed estimates but the more importantly, New Orders for Non-Defense Capital Goods ex-Aircraft rose just 0.2% vs. (E) 0.4%, although revisions to the February data were positive.

Meanwhile, inflation metrics firmed up last week. First, the PCE Price Index in Friday’s GDP report rose 2.2% vs. (E) 2.0%, while the Employment Cost Index, a quarterly gauge of compensation expenses, rose 0.8% in Q1 vs. (E) 0.4%. Those higher inflation readings were why you saw the dollar rally pre-open Friday despite the disappointing GDP report.

Bottom line, the economic data over the past several weeks hasn’t been “bad” and it’s not like anyone is worried about a recession. But, the pace of gains has clearly slowed, and until we see a resumption of the economic acceleration many analysts were expecting at the start of 2017, any material stock rally from here will not be economically or fundamentally supported (and remember, it was the turn in economic data back in August/September that ignited the late 2016 rally. Yes, the election helped, but the momentum was positive before that event, so economics do matter).

This Week in Economics – 5.1.17

Economic data this week could go a long way towards helping to resolve the large gap between soft sentiment surveys and hard economic data, given the large volume of economic reports looming this week.

First, it’s jobs week, so we get the ADP Employment Report on Wednesday and the official jobs report on Friday. We’ll do our typical “Goldilocks Jobs Report Preview” on Thursday, but after March’s disappointing jobs number, the risks to this report are more balanced (it could easily be too hot if the number is strong and there are positive revisions, or it could be too cold and further fuel worries about the pace of growth).

Second in importance this week is the Fed meeting on Wednesday. The reason this is second in importance is because it’s widely assumed the Fed won’t hike rates at this meeting (June is the next most likely date for a rate hike), although the Fed has turned slightly more hawkish so there’s always the possibility. We’ll send our FOMC Preview in Wednesday’s report but the wildcard for this meeting is whether the Fed gives us any more color into how it plans to reduce its balance sheet. If the Fed does reference or start to explain how its plans to reduce its balance sheet, that could be a hawkish surprise for markets.

Finally, we get the global manufacturing and composite PMIs this week. Most of Europe is closed today for May Day so just the US ISM Manufacturing PMI comes today, with the European and Japanese numbers out tomorrow. Then, on Wednesday, we get the US Service Sector PMI and global composite PMIs on Thursday. The global numbers should be fine but the focus will be on the US data. In March we saw a loss of positive momentum in these indices but the absolute levels of activity remained healthy. If we see more moderation and declines in the ISM Manufacturing and Non-Manufacturing PMIs in April, that will stoke worries about the overall pace of growth in the economy and that will be a headwind on stocks.

Bottom line, this a pretty pivotal week for the markets. On one hand, if economic data is strong and the Fed a non-event, the S&P 500 could push and potentially break-through 2400. Conversely, if economic data is underwhelming and the Fed mildly hawkish, we could easily see last week’s earnings/French election rally given back, and the S&P 500 could fall back into the middle of the 2300-2400 two months long trading range.

The Sevens Report is your weekly cheat sheet. Get a free two-week trial: 7sReport.com.

Fed Balance Sheet Primer, April 11, 2016

Fed Balance Sheet Primer

An excerpt below from today’s subscriber edition of Sevens Report.

Fed Balance Sheet Primer

Markets remain consumed by politics and geopolitics, but really the biggest macro surprise so far for 2017 came from the Fed last week, with the realization that they could begin to shrink their balance sheet in 2017. That event has potentially hawkish implications for bonds (bonds lower, yields higher), the dollar (higher) and stocks (increased headwind).

We initially warned about this possibility back in mid-March in our FOMC Preview. And, as we said back then, you’re going to be reading a lot more about this in the coming weeks, so I want to cover this topic more fully so that everyone has proper context.

Why Is The Fed Balance Sheet Important? The Fed balance sheet has ballooned over the past eight years given all the bonds it has purchased through the various QE programs. Unwinding that balance sheet without up-setting asset markets is quickly becoming the Fed’s highest priority.

To get specific, right now the Fed reinvests all the proceeds from a matured bond on its balance sheet—but that’s going to change. If the Fed gets $100 million in short-term Treasuries redeemed, right now it simply buys $100 million worth of new Treasuries. But when the Fed stops that reinvestment, that $100 million wouldn’t go back into the bond market, removing a source of demand.

The point is that when the Fed stops reinvesting principal, that will be potentially bond negative/yield positive, and that process needs to be managed very carefully considering the size of the balance sheet ($2.4 trillion in Treasuries, $1.7 trillion in mortgage backed securities).

When Will the Fed Stop Reinvesting All Bond Proceeds? Until last Wednesday, the unanimous answer would have been “2018.” But, following the Minutes, it’s looking more likely that the Fed could begin to end reinvestment of proceeds in December 2017.

Very Hawkish If:… Hawkish If:… Neutral If:… Dovish If:…

The above section is withheld for subscribers—sign up for a free trial to unlock.

What Will the Fed Stop Buying? Right now, the Fed rein-vests proceeds from both Treasuries and Mortgage-Backed Securities (MBS), so the question facing markets is whether the Fed will stop reinvestments in just one of these two securities, or whether it will stop reinvestments in both. Until the Minutes, it was assumed the Fed would only begin halting reinvestments in MBS (that way they could further support Treasuries, the more critically important market).

Hawkish If: … Neutral If: …

The above section is withheld for subscribers—sign up for a free trial to unlock.

How Will the Fed Stop Reinvesting Proceeds? The major question here is whether the Fed will slowly reduce the amount of reinvestment gradually, or whether it will just halt reinvestments all together. To illustrate the point, if one week the Fed has $100 million in bonds paying off, will they reinvest $50 of the $100 and reduce that number gradually over time, or will they just not reinvest any of the $100?

Given Fed history, a gradual reduction is what everyone expects; however, in the Minutes they talked about zero reinvestment, and it seems like the Fed is getting a bit antsy to get policy closer to normal.

Hawkish If:… Neutral If:…

The above section is withheld for subscribers—sign up for a free trial to unlock.

Bottom Line

This topic isn’t exactly exciting, and it won’t grab the headlines, but it is shaping up to be one of the bigger market influences in 2017. The reason why is simple: No one knows what’s going to happen to the bond market once the Fed begins to remove itself. On a percentage basis, it’s not like the Fed dominates the daily trading in Treasury markets. Yet sentiment is a funny thing, and the Fed needs to manage the unwind of a $4.1 trillion balance sheet successfully, because the potential for some sort of a market dislocation (especially in the age of algorithms and HFTs) isn’t insignificant. So, please keep this primer as a reference point, because I would be shocked if the Fed balance sheet doesn’t cause some sort of volatility in 2017 (beyond just the Wednesday reversal the news caused last week).

Join hundreds of advisors from huge brokerage firms like Morgan Stanley, Merrill Lynch, Wells Fargo Advisors, Raymond James and more… see if The Sevens Report is right for you.

Last Week and This Week in Economics, April 3, 2017

“Last Week and This Week in Economics”—an excerpt from today’s Sevens Report: everything you need to know about the markets in your inbox by 7am, in 7 minutes or less.

Last Week

Sevens Report - April 3, 2017 - This Week and Last WeekEconomic data was sparse again last week, but what data did come beat expectations (although it didn’t do a lot to bridge the gap between survey-based indicators and hard economic data). Still, the numbers did continue to be enough to offset growing Washington noise.

Consumer confidence was the highlight of the week, and it blew away expectations. The number rose to the highest level since summer 2001, coming in at 125.6 vs. (E) 113.8. While a strong number, that is another sentiment survey, and these soaring sentiment surveys need to start reflecting in the hard data starting in Q2 (remember, Q1 GDP is still expected to be around 1%).

The other notable number last week was Pending Home Sales, which also beat estimates, rising 5.5% vs. (E) 2.5%. The biggest takeaway from the March housing data is that it appears higher mortgage rates are not hurting the residential housing market, and that’s an important but underappreciated tailwind on the economy, generally speaking. Going forward, a stable housing market remains critical if there’s any hope to seeing a material economic acceleration.

Bottom line, the last two weeks have been light on economic data, but what numbers we’ve got have generally been good, and as a broad statement the economic data has continued to offset lack of progress in Washington… but that trend will be put to the test this week.

This Week

After two quiet weeks of economic releases, we more than make up for it this week, as the three most-important economic releases of the month all come over the next five days. From a broader context standpoint, with Washington stuck in neutral and hopes of big tax reform fading, economic data needs to stay firm to support stocks. If the data disappoints this week, don’t be surprised if we test last week’s lows.

The most important release this week is Friday’s jobs report. We will do our typical “Jobs Report Preview” later this week, but again it’s important this number is Goldilocks, in that it’s strong enough to support the market, but not so strong that it makes a May rate hike more likely.

The next most-important release this week is the global manufacturing PMIs (out today). The European and Asian numbers have already been released, and focus now turns to the March ISM Manufacturing PMI at 10 a.m. today. This number is taking on a bit more significance due to the disappointment of the flash manufacturing PMI of two weeks ago. It hit a surprise six-month low, so markets will want to see the ISM Manufacturing PMI refute that reading.

The manufacturing PMI is followed by the global manufacturing PMIs out Tuesday night/Wednesday morning. Those reports will again potentially confirm the uptick in global growth, and especially in Europe, where numbers have been strong lately. Domestically, it’s the same story. Economic data needs to support this market in the face of disappointment from Washington. Failure to do that puts this rally at risk.

The only other notable event this week will be the ECB minutes. If the minutes read hawkish, that could put a temporary headwind on HEDJ and long Europe positions. But a dip will likely be a buying opportunity in HEDJ.

Help your clients outperform markets with the Sevens Report. Claim your free trial today: 7sReport.com.

Economics, This Week and Last Week, March 20, 2017

Every Monday in the Sevens Report, you’ll find a review of last week and a preview of this week. Sign up for your free trial today and start each week “sevens strong.”

Sevens Report - Last Week and This WeekLast week was generally “Goldilocks” from an economic data and Fed standpoint, as economic data continued to be buoyant while the Fed successfully executed a dovish hike (at least in the short term).

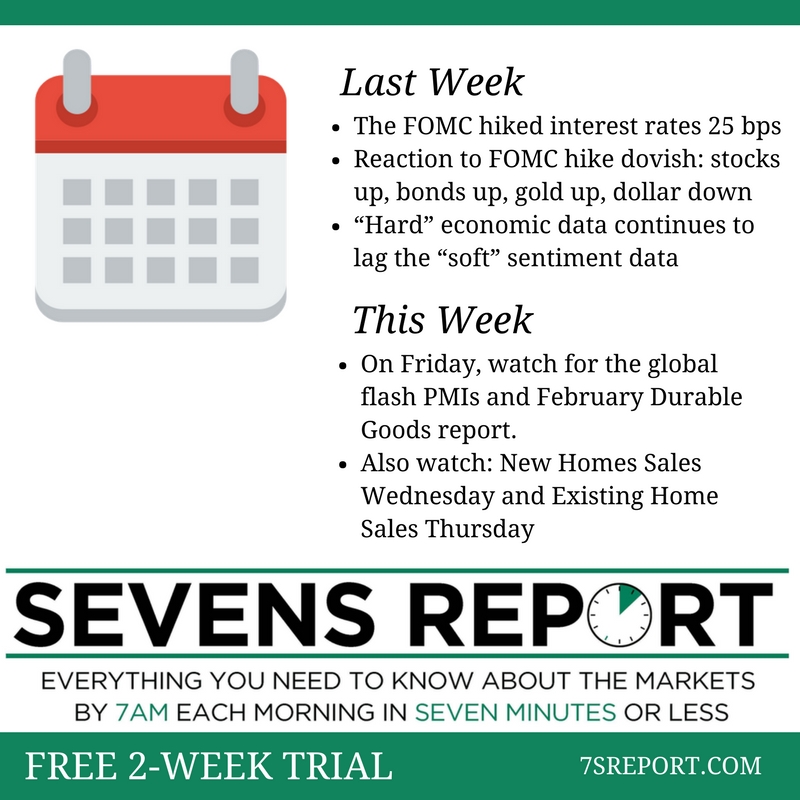
Starting with the Fed, the FOMC hiked interest rates 25 bps, as expected, but left the dot projections for 2017 and 2018 unchanged at three hikes each. Given market expectations for an increase in the dots, the reaction was immediately dovish (stocks up, bonds up, gold up, dollar down).

As we said last week, it’s important to see the forest for the trees. Regardless of the Fed’s projections, the first hike of 2017 came three months earlier than expected, and the question going forward isn’t whether the Fed hikes again, but “when” and “how often.”

If inflation data keeps rising and economic activity accelerates (or we actually get corporate tax cuts) the answers to those rate hike questions will be “soon,” and “more than three times.” Point being, don’t confuse the short-term dovish reaction with a reduction in risk from a hawkish Fed throughout 2017. The risk hasn’t changed.

Looking at the economic data last week, it showed an ongoing “reflation trade,” as inflation and growth data beat estimates. Both February PPI and CPI ran a touch “hot,” and showed either bigger-than-expected monthly increases (PPI) or year-over-year price increases that were the biggest in several years (headline CPI rising by 2.7%).

Meanwhile, the first economic data points from March, Empire Manufacturing and Philly Fed, also both beat expectations. Philly was 32.8 vs. (E) 30.0 and New Orders, the leading indicator of the report, rose to 38.6, which is the highest since 1983!

Actual “hard” economic data last week was a touch disappointing on the headline as Retail Sales met expectations and the “Control” group (the best measure of discretionary consumer spending) rose just 0.1% vs. (E) 0.3%. Revisions to the January data were positive and offset the disappointment, though (January control retail sales were revised to 0.8% from 0.4%).

It was a similar result with February Industrial Production being flat vs. (E) 0.2%. However, January data was revised slightly better to -0.1% vs. -0.3%. Meanwhile, the manufacturing sub-index was more positive (up 0.5% vs. (E) 0.4% and January was revised to 0.5% from 0.2%).

Bottom line, the “hard” economic data continues to lag the “soft” sentiment data (i.e. Philly/Empire Surveys) and the running estimate for Q1 GDP (the Atlanta Fed’s GDP Now) is just 0.9%, the lowest in nearly a year.

Again, it’s not an indictment of the rally just yet, but at some point, that GDP number needs to start to rise to meet the surging survey data, otherwise we’ve got a problem.

This Week: Economically speaking this will be a generally quiet week, as the notable data doesn’t come until Friday via the global flash PMIs and February Durable Goods report.

Yet despite the small number of reports, the data is still important, because it has got to continue to help support stocks in the face of ever-dimming policy prospects. So, those numbers (especially durable goods) need to continue to imply economic acceleration.

Other data to watch this week includes housing data (New Homes Sales Wednesday and Existing Home Sales Thursday), but generally housing continues to hold up well in the face of generally higher rates.

The Sevens Report is everything you need to know about the market, in your inbox by 7am each morning, in 7 minutes or less. Get a free trial!

FOMC Takeaways, March 17, 2017

Linda Yellen

The FOMC raised the fed funds rate 25 basis points, as expected.

The FOMC raised the fed funds rate 25 basis points, as expected.

Below is an excerpt from the full Sevens Report, focusing on the takeaways from the March 15, 2017 Fed meeting. The Sevens Report is everything you need to know about the markets in your inbox by 7am in 7 minutes or less. Sign up for a free 2-week trial today!

Takeaway

The results of this meeting largely met our “What’s Expected,” scenario, as the Fed did hike 25 basis points, but the median “dots” for the number of hikes in 2017 and 2018 were unchanged at three in each year.

So, the Fed generally met well-telegraphed expectations, and the market took it dovishly (as you’d expect). Futures doubled their pre-Fed gains while the dollar dropped sharply and bonds rallied.

Yet, despite the initial moves, I don’t see Thursday’s Fed decision as a bullish game changer, simply because unless we get a surprise downturn in economic data (which won’t be good for stocks), risk still remains for more rate hikes going forward.

So despite the somewhat confusing Fed tactic of rushing to hike in March, only to keep the statement and projections dovish, I’m sticking with my expected market reactions… Stocks rallied, but this isn’t a bullish game-changer; bond yields dropped but it’s likely not a reversal in the uptrend in yields (same for the dollar), and gold rallied and while we may not see a sustained rally just yet, the outlook is becoming more favorable.

Going forward, the market still expects two more hikes in 2017, with June being a close call.

CPI

  • February CPI rose 0.1%, meeting expectations.
  • Core CPI rose 0.2%, also meeting expectations

Takeaway

CPI inflation data largely met expectations on March 15th and the numbers likely didn’t have any effect on the FOMC decision. However, the important point here is that PPI and CPI both confirmed inflation pressures continue to build. Case in point, the year-over-year headline CPI rose to 2.7%, which is a five-year high, while core rose to 2.2%, above the Fed’s stated 2% goal.

From a practical investment management standpoint, this continues to underscore the need for investors to make sure they are positively skewed to inflation for medium- and longer-term accounts (i.e. more equity exposure, reduced long-term bond exposure, TIPS exposure, select hard asset exposure).

Retail Sales

  • February retail sales rose 0.1%, meeting expectations.

Takeaway

There was some noise to cut through in this report, because while the headline met expectations, the more important “control” group (retail sales less autos, gas and building materials) rose just 0.1% vs. (E) 0.3%.

Again, we and others look at the control group because it’s the best measure of discretionary consumer spending. And while that number did miss estimates, the January data saw a big, positive revision, as the control group went from up 0.4% in January to 0.8%. All in all, the numbers were basically in line.

From a market standpoint, this retail sales number still leaves a large and uncomfortable gap between sentiment data (like the Empire Manufacturing Survey and PMIs, which are very strong) and actual, hard data.

Case in point, the Atlanta Fed GDP Now estimate for Q1 GDP fell to 0.9%—hardly robust growth.

Yes, for now the expectation of better growth is off-setting lackluster hard data, but at some point the hard data needs to start to reflect these high sentiment surveys.

This FOMC review is part of the full Sevens Report. For a monthly cost of less than one client lunch, we firmly believe we offer the best value in the independent research space—and you can get two weeks free by signing up for our trial version. Try it today and see what a difference the Sevens Report can make for you every morning.

FOMC Preview, March 14, 2017

FOMC Preview

Federal Open Market CommitteeDespite the near-universal expectation of a 25-basis-point rate hike at tomorrow’s FOMC meeting, this meeting contains a lot of very important unknowns regarding the pace of future rate hikes. As such, this meeting is a real, legitimate risk to stocks.

Get our full FOMC preview and all the analysis you need to stay ahead of the market with the Sevens Report. In your inbox by 7am, read it in 7 minutes or less.

It is not an exaggeration to say this Fed meeting could reflect a paradigm shift in the Fed, where the Fed actually gets serious about normalizing policy and interest rates.

Very Hawkish If: 1) The Fed hikes rates 25 bps, 2) The median “dots” show four rate hikes in 2017 and 3) The median dots show four rate hikes in 2018 (currently the dots show just three for both years).

Hawkish If: 1) The Fed hikes rates 25 bps, and 2) The median dots show four rate hikes in 2017 or 2018, but not both years.

Likely Market Reaction:  Restricted for subscribers. Get this data with your free trial of the Sevens Report.

ETFs to Outperform:

Inverse bonds (TBT/TBF/PST), financials (XLF), banks (maybe, but that depends on the shape of the yield curve), TIPS-related bond ETFs (VTIP). ETFs to Underperform: Utilities (XLU), REITs (VNQ) (both interest rate plays), commodity ETFs (DBC), basic materials (XLB), energy (XLE), gold (GLD, GDX).

Meets Expectations If: The Fed hikes rates 25 basis points but the dots don’t shift in either year (i.e. the median dots still show three rate hikes in 2017 or 2018).

Likely Market Reaction:  Restricted for subscribers. Get this data with your free trial of the Sevens Report.

Dovish If: The Fed does not hike rates (this would frankly be a shocking surprise given recent Fed rhetoric). Likely Market Reaction: Stocks, gold and other commodities sharply higher (at least initially). Treasury yields and the dollar sharply lower.

Wildcard to Watch:

The Fed’s Balance Sheet. This is a bit of a confusing topic, but you’re going to be reading a lot more about this in the coming weeks, so I want to cover it now so everyone has proper context. With the Fed hiking rates, it’s quickly approaching the time when the Fed will have to naturally reduce its balance sheet. And what I and others mean by that is the Fed will have to stop reinvesting the principal that it receives when the Treasuries it owns are redeemed.

The reason this is important is because it could put further pressure on the bond market. If the Fed gets $100 million in short-term Treasuries redeemed, right now it simply buys $100 million worth of new Treasuries. But, if the Fed were to stop reinvestment, that $100 million wouldn’t go back into the bond market, removing a source of demand.

The point is that when the Fed stops reinvesting principal, that will be potentially bond negative/yield positive, and that process needs to be managed very carefully considering the size of the Fed’s balance sheet ($2.4 trillion in Treasuries, $1.7 trillion in mortgage backed securities).

Bottom line, if the Fed changes the language on the reinvestment of the balance sheet (it’ll be in the second to last paragraph in the FOMC statement) then that would be incrementally hawkish, and we’d likely see bond yields and the dollar higher, and stocks lower. The market is not at all expecting any impending balance sheet changes from the Fed this soon in 2017.

Help your clients outperform markets with your free trial of the Sevens Report.