10 Year Note Yield Continues to Fall
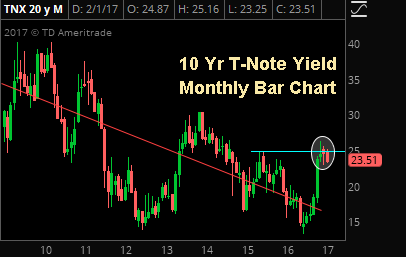
The 10 Yr T-Note yield remains below the key 2.50% level and a considerable distance from the long term regression line which suggests a further correction is very plausible.
The 10 Yr T-Note yield remains below the key 2.50% level and a considerable distance from the long term regression line which suggests a further correction is very plausible.
A friend who runs a successful tax lien fund called me this past weekend with an interesting story.
The portfolio manager of one of the biggest institutional investors, a $2-plus billion multi-family office on the West Coast, called him last week and told him to expect a bigger allocation soon because he (the PM of that multi-family office) had reduced the fund’s corporate bond exposure to 0%.
Bond Bubble
The reason: Liquidity fears.
 That PM believes, like I and others do, that the bond market (especially the corporate bond market) is a bubble that has started to pop. And while so far the decline in bonds has been somewhat orderly, this PM believes the risk to corporate bond funds is enough that he wants zero exposure in the fund.
Specifically, he thinks that the enormous amount of capital that has flowed into bond funds and ETFs over the past several years represents a real liquidity risk to the corporate bond market.
The reason is two fold. First, much of that money has flowed into funds and ETFs, which must provide daily liquidity—and a lot of the specific corporate bonds these funds and ETFs own simply don’t have good daily liquidity. Second, due in part to Dodd-Frank, bond dealer desks and inventory have been significantly reduced, meaning there are less available buyers in the event of a stampede towards the exits.
Add on top of that the potential for algorithms to exacerbate moves across asset classes, and we now have the potential for a very small opening for a very large crowd should a selling rush occur.
Now, this PM isn’t unique in his fear. In fact, I’ve spoken to some readers about this very scenario. But what caught me as particularly interesting about this story is that the PM of this multi-family office took the corporate bond exposure to 0%.
Having been on the buy side, I know he must have a lot of conviction to take that exposure to zero. As we all know, corporate bonds have massively outperformed over the past few years, and investors will ask why he’s dumping something that’s worked so well. Bottom line, zero exposure requires a lot of conviction—and a good explanation.
Of course, this is just one story, and while my friend vouches for this PM’s intelligence and experience (he was the PM of this multi-family office through the 2008 crisis), I don’t know him personally.
Still, to reinforce the point, the PM told my friend that he believes his fears were confirmed because when he tried to sell the final $10M worth of corporate bonds in the portfolio, and it took him two days to get reasonable bids on all the individual bonds.
Bottom line, I’ll be the first to admit I’ve been early trying to get ahead of any damage from the bursting of a bond bubble… but that doesn’t mean it won’t happen. I also think that if we see the bond decline accelerate, it
could easily become the biggest potential negative for asset markets that we’ve seen since the financial crisis.
I’m going to continue to look out for this, because if I can help everyone avoid what I think will be one hell of a mess in a declining bond market, I’ll have paid for myself for years!
Economics
Takeaways
Data was mixed yesterday as the Trade Balance was slightly smaller than expected (a nominal positive), while JOLTS (Job Openings and Labor Turnover) were slightly lower than expected (a nominal negative).
But, neither number is influencing anyone’s outlook on the economy, as the December Trade Balance won’t have any effect on Q4 GDP while JOLTS remains generally strong over a longer time horizon, and other employment metrics remain good (most recently the monthly jobs report).
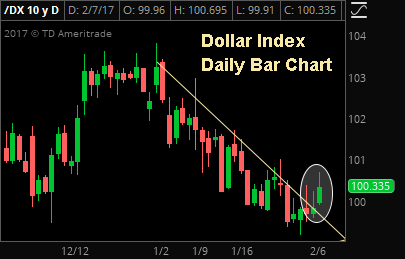
The dollar index violated the 2017 downtrend yesterday which could mark the beginning of the next upswing for the greenback.
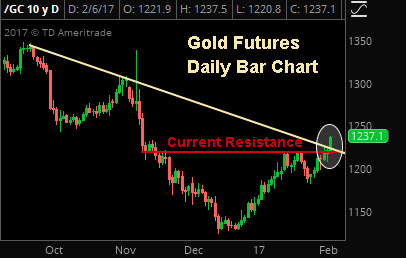
Gold futures violated a longstanding downtrend resistance line yesterday as well as established above the $1235 resistance area; two bullish technical developments.
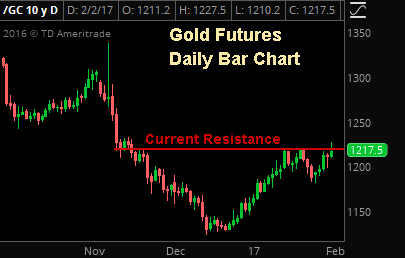
Gold has rebounded solidly this year but continues to stall at key resistance between $1220 and $1235. Until futures establish above that level, the outlook remains neutral with a downside bias.
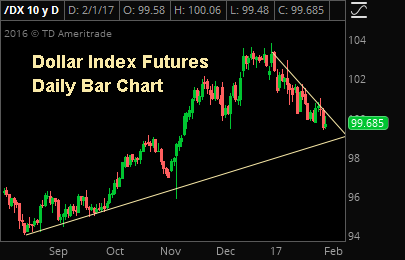
Near term, the dollar index is in a steep down trend that began at the turn of the year. Longer term however, the broader trend in the market remains a bullish one for now.
The Oil Market: Now and Then
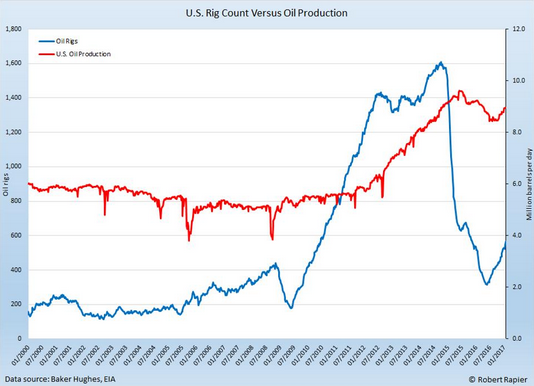
We have included in today’s report a chart that was featured in a Forbes article yesterday regarding the two main influences on the oil market right now: rising US output and OPEC/NOPEC production cuts. At first look, the chart suggests that using hindsight as a gauge, US production lags the rise in rig counts which supports the argument that US production will not rise fast enough to offset the OPEC/NOPEC efforts. But we think that argument is flawed and here is why.
During the last aggressive expansionary phase for US oil production (rising US rig counts/increasing output) which lasted from 2009 to 2014, oil prices were wavering between about $80 and $110/bbl. The correlation between the pace of rig count growth and production growth was rather low as you can see by the difference between the slopes of the two lines in the chart. The likely and simple reason for that low correlation is the fact that there was a lot wild cat drilling, thanks to a surge in industry investment, that turned out to be unsuccessful.
In today’s lower price environment, efficiency is key and exploratory drilling, especially in unconventional areas, is at a minimum while producers focus their time, efforts, and investments on reliable sources of oil with considerably lower lift costs. If this is indeed the case as we believe it is and a good portion of the increasing rig counts that are being reported by BHI are actually DUCs (Drilled but Uncompleted wells) in proven areas, then the relationship between rig counts and production should have a tighter correlation than it did 5-10 years ago.
Bottom line, the fundamental backdrop of the energy market is different right now than it was between 2009 and 2014 and because investment in energy is much lower while the industry remains focused on efficiency, we are more likely to see a tighter correlation between rising rig counts and rising US production which would result in a faster pace of production growth. That in turn would offset the efforts of global producers who are trying to support prices and as a result, leave us in a “lower for longer” oil environment.
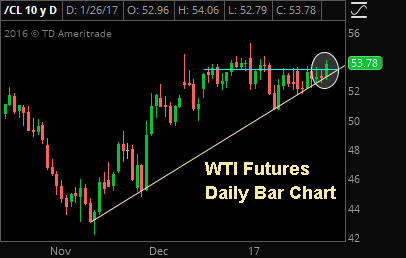
WTI crude oil futures broke out of a multi-week trading range yesterday and closed just shy of a new 2017 high as a sellers-strike continues ahead of data releases that could confirm (or discredit) proposed global output cuts.
Here is a “Stock Market Update” from The Sevens Report: Stocks finally moved Tuesday, as the S&P 500 staged a modest rally following good economic data and well received (but not really positive) political headlines. The S&P 500 rose 0.66%.
 Stocks were flat to start Wednesday trade thanks to generally “ok” economic data from Europe (the European and German flash PMIs were light). There were also a lot of earnings reports, but they were the normal gives and takes, and none of the big companies reporting really moved markets beyond their specific sector (JNJ weighed on healthcare, but that’s it).
After the flat open, stocks started moving higher following a strong January flash manufacturing PMI, and the gains accelerated following several political headlines.
First, the Trump/auto company CEOs meeting was uneventful; then Democrats unveiled a $ 1 trillion infrastructure spending bill, and finally the president signed executive orders to reopen negotiations on the Keystone and Dakota Access pipelines. Stocks hit their highs early afternoon, and the S&P 500 made a new fractional all-time high before backing off just a bit into the close.
Stock Market Update: Trading Color
Yesterday was the first big Trump On day in markets since the first few days of 2017, as small caps and cyclicals handily outperformed.
The Russell 2000 rose 1.5%, more than doubling the S&P 500’s performance while cyclical sectors handily outperformed. Banks (KRE), financials (XLF), industrials (XLI) and basic materials (XLB) all rose more than 1%, with the
latter rising nearly 3% on a big DuPont (DD) earnings beat that pushed the Dow higher (they are heavily weighted in XLB, so the strength there was chemicals based, not commodity based).
Outside of DD earnings there weren’t really any big market movers, with the exception of JNJ weighing on the healthcare sector. XLV dropped 0.70% on the JNJ miss, although the weakness was somewhat isolated as the Healthcare Providers ETF (IHF) rose 0.29%.
Most of the remaining SPDRs we track were up about 0.60% (including consumer staples, which traded pretty well), although utilities were only fractionally higher on the rise in bond yields.
Bottom line, none of the political actions mentioned yesterday were surprises, but overall it was a generally business friendly day of headlines from Washington. That, combined with the PMIs, helped stocks rally.
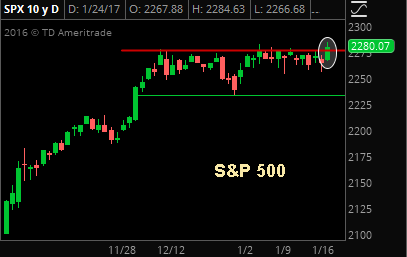
S&P Chart: “A new high” is the oldest confirmation signal of a bull market in technical analysis and the S&P reached a new all-time high yesterday leaving the path of least resistance higher still from here.