Reopened vs. Normal
What’s in Today’s Report:
- What’s Next for the Economy: Reopened vs. Normal
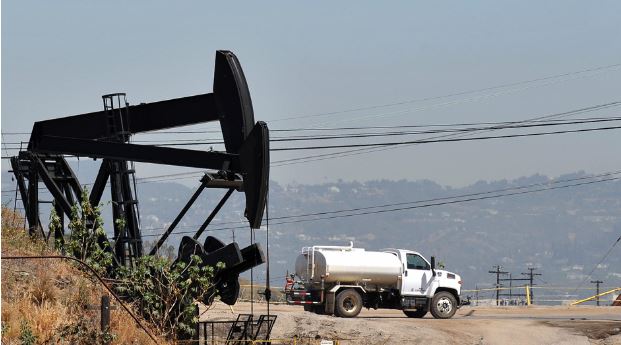
- Oil Inventory Analysis
Futures are slightly lower as markets digest Wednesday’s rally and, so far, ignore very soft economic data.
April global flash PMIs were horrible and worse than feared. The EU composite PMI collapsed to 13.5 vs. (E) 26, the British composite PMI imploded to 12.9 vs. (E) 32, and the Japanese composite dropped to 27.8 vs. the prior 36.2.
The weak PMIs show the scope of the economic damage, and it’s bad, but hope remains for a rebound in the coming months given trend in the virus data, and that’s why these historically bad numbers aren’t causing a deeper sell off this morning.
Focus today will be on economic data, via Jobless Claims (E: 4.000MM) and the U.S. April Composite Flash PMIs (E: 37.5). If both numbers are not as bad as feared, and combined with the chatter of economic “reopening,” then stocks can extend yesterday’s rally. We also get New Home Sales (E: 632K), although that shouldn’t move markets.