One of the most enjoyable parts of my morning routine is reading about the history of each day, because doing this task daily shows you that indeed, history doesn’t necessarily repeat, but it does rhyme—and that was true again this morning.
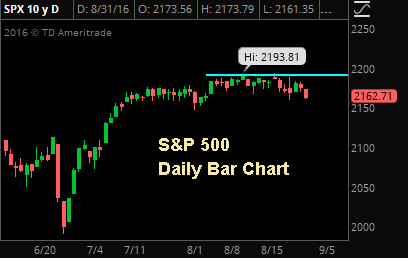
Since Friday, stocks have been under modest pressure
as expectations for a 2016 rate hike go up, but the selloffs have been mostly contained, because at the Jackson Hole Fed conference last week Fed Chair Yellen declared that regardless of when the Fed hikes rates, overall interest rates will remain historically low for many, many years.
Well, today’s date in history offers a pointed example (one that was much more important than monetary policy) that the best of intentions sometimes simply can’t be fulfilled.
On this day in 1935, then President Franklin D. Roosevelt signed Senate Joint Resolution 173, better known as the “Neutrality Act.”
It was a well thought out, well supported law that showed clearly the US had no intention of entering into any potential war in Europe. It was the right thing to do at the time and the intentions were clear.
And, we all know what happened a few years later.
My point?
You can have a carefully crafted set of polices built on the best of intentions, but a lot can change in just a few months.
The reason this event in history caught my attention is because over the past several days, in the wake of Fed Vice Chair Stan Fischer’s “hawkish” comments Friday and yesterday, the bulls started to downplay any potential negative influence of a rate hike because it’ll be what they call a “Dovish Hike,” or, a single rate hike followed by no hikes for a very, very long time. As such, the rate hike itself won’t be bearish for stocks.
Maybe that’s true, but the fact of the matter is the Fed has a very bad record of long-term forecasting (more on that below), so as the “Dovish Hike” scenario grows in popularity as a justification to buy stocks regardless of what the Fed does, I want to make sure that investors and advisors know:
1) What a “Dovish Hike” is,
2) What a “Dovish Hike” means for stocks, and
3) Why We Don’t Think a “Dovish Hike” Is a Reason to Buy Stocks
I know the long weekend is approaching and the last thing anyone wants to do is try and game the near-term path of interest rates, but the fact of the matter is we are approaching a tipping point in the bond market, and how it goes will have significant consequences on investor’s portfolios… because if this bond market breaks down and bond yields move higher, that will cause both stocks and bonds to drop at the same time.
So, it’s critical that investors understand, at least generally, what issues are facing the bond market and that you are following an analyst who understands what will move the bond market and who is watching it every day, because with 6 potential market moving events looming over the next month, waiting for a generic, dated, perma-bull piece from your custodians CIO isn’t going to cut it… not with a bond and stock market that are both still very extended.
We’ve included an excerpt of recent bond research for you below. Full, paid subscribers to The Sevens Report
received this information earlier this week along with specific tactical ETF suggestions to navigate the current environment.
What Is A “Dovish Hike?” (And Is It Good for Stocks?)
If the Fed is planning on executing a “Dovish Hike” it won’t be a medium- or longer-term headwind on stocks, but if it’s not a “Dovish Hike” and it’s the first of several, that will be an unanticipated headwind on stocks—so I want to make sure everyone is aware of what a “Dovish Hike” is, and why it’s not bearish short term, but at the same time also is not a reason to buy stocks.
What Is a Dovish Hike? A “Dovish Hike” is a clever title for a monetary policy strategy whereby the Fed raises Fed funds 25 basis points, but then explicitly says that the ceiling for the Fed funds rate is much, much lower than it was in the past (say 3% vs. previous 6%). So while the Fed is hiking rates, it can’t hike them very far given the economy.
What Does a “Dovish Hike” Mean for Stocks? Ostensibly, it’s positive beyond the short term. Yes, the idea that the Fed may raise rates sooner than later would be a potential short-term headwind. But beyond that, the idea that interest rates can’t return to pre-crisis levels is, supposedly, fundamentally dovish and it would help fuel a continued “low-rates-forever” rally. Assuming neither the BOJ nor ECB surprise markets hawkishly in September, a dovish hike in September would not mean that the rally cannot continue into the fourth quarter.
That Said, Is a Dovish Hike a Reason to Buy Stocks? No, We Don’t Think So (at least not for medium- or long-term investors). First, the Fed is no longer in control of longer-term interest rates, at least in the near term, so regardless of whether they keep Fed funds low over the next several years that likely won’t have that much effect on the direction of longer-term rates… and those rates are the key to the next move in stocks.
Second, the Fed’s longer-term forecasting ability is, frankly, terrible, so I’m hesitant to believe them when they say they know the new “long-term” ceiling for interest rates. As a reminder, in 2012, when the Fed first released the “dot” projections, many Fed officials had the Fed funds rate above 1% in 2014, and several had it above 2%… in 2014!
Point being, no one at the Fed knows what’s going to happen over the very longer term. They may believe that they’ll stay dovish for longer, but that simply may not be possible depending on a variety of factors, including what the ECB or BOJ do with policy, the global economy, inflation, etc. Bottom line, buying (or selling) stocks based on the Fed’s longer-term forecasts has not been the most successful investment strategy, and I don’t think this time will be different.
So, while the idea of a “Dovish Hike” could be a short-term catalyst for stocks, we do not see that as the catalyst for a real, sustained move higher unless it’s accompanied by very dovish actions by the BOJ or ECB. Until then, we will remain cautious and continue to contend that better economic growth is the key to a real, sustainable rally in stocks, not perma-low rates to compensate for anemic growth.
Bottom line, despite the media focus on a September or December hike, the more important issue with Fed policy is what they do after the next hike, as that will be a major factor in whether the S&P 500 can make significant gains from current levels.
What to Do Now: Tactical Allocation Ideas
The “Dovish Hike” scenario may not have a major influence on the broad markets initially, but it will have a continued influence on sector trading, specifically whether we see, finally, the start of a “Great Rotation” out of income-oriented sectors and into more cyclical sectors.
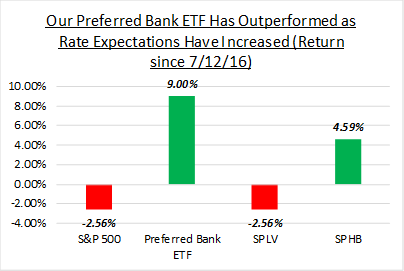
Several weeks ago we bought a regional bank ETF that we believed would help reduce any relative underperformance if we saw the start of a rotation out of safety and into cyclicals.
That decision has proven wise, because since then that ETF has rallied almost 9%, outperforming other cyclical sectors be nearly 5% and outperforming the S&P 500 by over 11% in just under two months!
If we do see a sooner-than-expected rate hike from the Fed, regardless of whether it’s a “Dovish Hike” or not, this ETF will continue to significantly outperform the S&P 500 and defensive, income-oriented sectors more generally, and we have continued to remind paid subscribers of this specific ETF.
We’re committed to making sure subscribers to our full morning report have the independent analysis they need to navigate macro risks while at the same time having the tactical idea generation that can help their clients outperform.
If your paid subscription research isn’t giving you talking points to discuss with clients, monitoring the macro horizon to keep you aware of risks, and providing tactical allocation suggestions and idea generation, then please consider a quarterly subscription to The Sevens Report.
If all we do is help you get one client, that will more than pay for the subscription!
I am continuing to extend a special offer to new subscribers of our full, daily report that we call our “2-week grace period.”
If you subscribe to The Sevens Report today, and after the first two weeks you are not completely satisfied, we will refund your first quarterly payment, in full, no questions asked.
Click this link to begin your quarterly subscription today.
Increased Market Volatility Will Be an Opportunity for the Informed Advisor and Investor
We aren’t market bears, but we said consistently that things were going to be volatile in 2016, and we were right!
And, as we approach a series of 6 critical macro events, starting with Friday’s Jobs Report, the advisor who is able to confidently and directly tell their nervous clients what’s happening with the markets and why stocks are up or down, and what the outlook is beyond the near term (without having to call them back), will be able to retain more clients and close more prospects.
We view volatility as a prime opportunity to help our paying subscribers grow their books of business and outperform markets by making sure that every trading day they know:
1) What’s driving markets
2) What it means for all asset classes, and
3) What to do with client portfolios.
We monitor just about every market on the globe, break down complex topics, tell you what you need to know, and give you ETFs and single stocks that can both outperform the market and protect client portfolios.
All for $65/month with no long term commitment.
I’m not pointing this out because I’m implying we get everything right.
But we have gotten the market right so far in 2016, and it has helped our subscribers outperform their competition and strengthen their relationships with their clients – because we all know the recent volatility has resulted in some nervous client calls.
Our subscribers were able to confidently tell their clients 1) Why the market was selling off, 2) That they had a plan to hedge if things got materially worse and 3) That they were on top of the situation.
That’s our job, each and every trading day.
And, we are good at it.
We watch all asset classes to generate clues and insight into the near-term direction of the markets, but our most important job is to remain vigilant to the next decline.
While we spend a lot of time trying to identify what’s really driving markets so our clients can be properly positioned, we also spend a lot of time identifying tactical, macro-based, fundamental opportunities that can help our clients outperform.
If you want research that comes with no long-term commitment, yet provides independent, value added, plain English analysis of complex macro topics, click the button below to begin your subscription today.

Finally, everything in business is a trade-off between capital and returns.
So, if you commit to an annual subscription, you get one month free, a savings of $65. To sign up for an annual subscription simply click here.

Best,
Tom
Tom Essaye
Editor, The Sevens Report