Posts
What is a Dovish Hike?
/in Investing/by Tyler RicheyOne of the most enjoyable parts of my morning routine is reading about the history of each day, because doing this task daily shows you that indeed, history doesn’t necessarily repeat, but it does rhyme—and that was true again this morning.

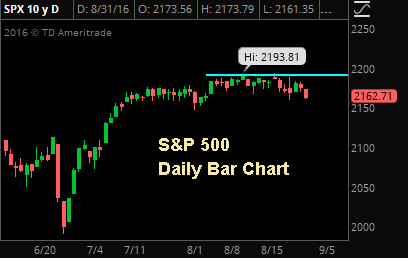
Since Friday, stocks have been under modest pressure
as expectations for a 2016 rate hike go up, but the selloffs have been mostly contained, because at the Jackson Hole Fed conference last week Fed Chair Yellen declared that regardless of when the Fed hikes rates, overall interest rates will remain historically low for many, many years.
Well, today’s date in history offers a pointed example (one that was much more important than monetary policy) that the best of intentions sometimes simply can’t be fulfilled.
On this day in 1935, then President Franklin D. Roosevelt signed Senate Joint Resolution 173, better known as the “Neutrality Act.”
It was a well thought out, well supported law that showed clearly the US had no intention of entering into any potential war in Europe. It was the right thing to do at the time and the intentions were clear.
And, we all know what happened a few years later.
My point?
You can have a carefully crafted set of polices built on the best of intentions, but a lot can change in just a few months.
The reason this event in history caught my attention is because over the past several days, in the wake of Fed Vice Chair Stan Fischer’s “hawkish” comments Friday and yesterday, the bulls started to downplay any potential negative influence of a rate hike because it’ll be what they call a “Dovish Hike,” or, a single rate hike followed by no hikes for a very, very long time. As such, the rate hike itself won’t be bearish for stocks.
Maybe that’s true, but the fact of the matter is the Fed has a very bad record of long-term forecasting (more on that below), so as the “Dovish Hike” scenario grows in popularity as a justification to buy stocks regardless of what the Fed does, I want to make sure that investors and advisors know:
1) What a “Dovish Hike” is,
2) What a “Dovish Hike” means for stocks, and
3) Why We Don’t Think a “Dovish Hike” Is a Reason to Buy Stocks
I know the long weekend is approaching and the last thing anyone wants to do is try and game the near-term path of interest rates, but the fact of the matter is we are approaching a tipping point in the bond market, and how it goes will have significant consequences on investor’s portfolios… because if this bond market breaks down and bond yields move higher, that will cause both stocks and bonds to drop at the same time.
So, it’s critical that investors understand, at least generally, what issues are facing the bond market and that you are following an analyst who understands what will move the bond market and who is watching it every day, because with 6 potential market moving events looming over the next month, waiting for a generic, dated, perma-bull piece from your custodians CIO isn’t going to cut it… not with a bond and stock market that are both still very extended.
We’ve included an excerpt of recent bond research for you below. Full, paid subscribers to The Sevens Report
received this information earlier this week along with specific tactical ETF suggestions to navigate the current environment.
What Is A “Dovish Hike?” (And Is It Good for Stocks?)
If the Fed is planning on executing a “Dovish Hike” it won’t be a medium- or longer-term headwind on stocks, but if it’s not a “Dovish Hike” and it’s the first of several, that will be an unanticipated headwind on stocks—so I want to make sure everyone is aware of what a “Dovish Hike” is, and why it’s not bearish short term, but at the same time also is not a reason to buy stocks.
What Is a Dovish Hike? A “Dovish Hike” is a clever title for a monetary policy strategy whereby the Fed raises Fed funds 25 basis points, but then explicitly says that the ceiling for the Fed funds rate is much, much lower than it was in the past (say 3% vs. previous 6%). So while the Fed is hiking rates, it can’t hike them very far given the economy.
What Does a “Dovish Hike” Mean for Stocks? Ostensibly, it’s positive beyond the short term. Yes, the idea that the Fed may raise rates sooner than later would be a potential short-term headwind. But beyond that, the idea that interest rates can’t return to pre-crisis levels is, supposedly, fundamentally dovish and it would help fuel a continued “low-rates-forever” rally. Assuming neither the BOJ nor ECB surprise markets hawkishly in September, a dovish hike in September would not mean that the rally cannot continue into the fourth quarter.
That Said, Is a Dovish Hike a Reason to Buy Stocks? No, We Don’t Think So (at least not for medium- or long-term investors). First, the Fed is no longer in control of longer-term interest rates, at least in the near term, so regardless of whether they keep Fed funds low over the next several years that likely won’t have that much effect on the direction of longer-term rates… and those rates are the key to the next move in stocks.
Second, the Fed’s longer-term forecasting ability is, frankly, terrible, so I’m hesitant to believe them when they say they know the new “long-term” ceiling for interest rates. As a reminder, in 2012, when the Fed first released the “dot” projections, many Fed officials had the Fed funds rate above 1% in 2014, and several had it above 2%… in 2014!
Point being, no one at the Fed knows what’s going to happen over the very longer term. They may believe that they’ll stay dovish for longer, but that simply may not be possible depending on a variety of factors, including what the ECB or BOJ do with policy, the global economy, inflation, etc. Bottom line, buying (or selling) stocks based on the Fed’s longer-term forecasts has not been the most successful investment strategy, and I don’t think this time will be different.
So, while the idea of a “Dovish Hike” could be a short-term catalyst for stocks, we do not see that as the catalyst for a real, sustained move higher unless it’s accompanied by very dovish actions by the BOJ or ECB. Until then, we will remain cautious and continue to contend that better economic growth is the key to a real, sustainable rally in stocks, not perma-low rates to compensate for anemic growth.
Bottom line, despite the media focus on a September or December hike, the more important issue with Fed policy is what they do after the next hike, as that will be a major factor in whether the S&P 500 can make significant gains from current levels.
What to Do Now: Tactical Allocation Ideas
The “Dovish Hike” scenario may not have a major influence on the broad markets initially, but it will have a continued influence on sector trading, specifically whether we see, finally, the start of a “Great Rotation” out of income-oriented sectors and into more cyclical sectors.

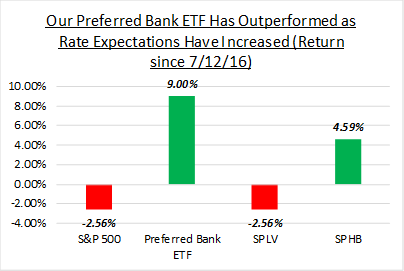
Several weeks ago we bought a regional bank ETF that we believed would help reduce any relative underperformance if we saw the start of a rotation out of safety and into cyclicals.
That decision has proven wise, because since then that ETF has rallied almost 9%, outperforming other cyclical sectors be nearly 5% and outperforming the S&P 500 by over 11% in just under two months!
If we do see a sooner-than-expected rate hike from the Fed, regardless of whether it’s a “Dovish Hike” or not, this ETF will continue to significantly outperform the S&P 500 and defensive, income-oriented sectors more generally, and we have continued to remind paid subscribers of this specific ETF.
We’re committed to making sure subscribers to our full morning report have the independent analysis they need to navigate macro risks while at the same time having the tactical idea generation that can help their clients outperform.
If your paid subscription research isn’t giving you talking points to discuss with clients, monitoring the macro horizon to keep you aware of risks, and providing tactical allocation suggestions and idea generation, then please consider a quarterly subscription to The Sevens Report.
If all we do is help you get one client, that will more than pay for the subscription!
I am continuing to extend a special offer to new subscribers of our full, daily report that we call our “2-week grace period.”
If you subscribe to The Sevens Report today, and after the first two weeks you are not completely satisfied, we will refund your first quarterly payment, in full, no questions asked.
Click this link to begin your quarterly subscription today.
Increased Market Volatility Will Be an Opportunity for the Informed Advisor and Investor
We aren’t market bears, but we said consistently that things were going to be volatile in 2016, and we were right!
And, as we approach a series of 6 critical macro events, starting with Friday’s Jobs Report, the advisor who is able to confidently and directly tell their nervous clients what’s happening with the markets and why stocks are up or down, and what the outlook is beyond the near term (without having to call them back), will be able to retain more clients and close more prospects.
We view volatility as a prime opportunity to help our paying subscribers grow their books of business and outperform markets by making sure that every trading day they know:
1) What’s driving markets
2) What it means for all asset classes, and
3) What to do with client portfolios.
We monitor just about every market on the globe, break down complex topics, tell you what you need to know, and give you ETFs and single stocks that can both outperform the market and protect client portfolios.
All for $65/month with no long term commitment.
I’m not pointing this out because I’m implying we get everything right.
But we have gotten the market right so far in 2016, and it has helped our subscribers outperform their competition and strengthen their relationships with their clients – because we all know the recent volatility has resulted in some nervous client calls.
Our subscribers were able to confidently tell their clients 1) Why the market was selling off, 2) That they had a plan to hedge if things got materially worse and 3) That they were on top of the situation.
That’s our job, each and every trading day.
And, we are good at it.
We watch all asset classes to generate clues and insight into the near-term direction of the markets, but our most important job is to remain vigilant to the next decline.
While we spend a lot of time trying to identify what’s really driving markets so our clients can be properly positioned, we also spend a lot of time identifying tactical, macro-based, fundamental opportunities that can help our clients outperform.
If you want research that comes with no long-term commitment, yet provides independent, value added, plain English analysis of complex macro topics, click the button below to begin your subscription today.
Finally, everything in business is a trade-off between capital and returns.
So, if you commit to an annual subscription, you get one month free, a savings of $65. To sign up for an annual subscription simply click here.
Best,
Tom
Tom Essaye
Editor, The Sevens Report
Stock Market Update: 7/11/2016
/in Investing/by Tyler Richey
Stocks surged last week thanks almost entirely to the post-jobs-report Friday rally. The S&P 500 rose 1.28% on the week, and is up 4.21% year to date, and now is within a few points of its all-time high.
Despite the gains, the week started with some volatility as the S&P 500 dropped 1% Tuesday following a plunge in European financials stemming from worries about Italian banks and fund redemption halts at British commercial property funds. But, the market acted resilient and stocks rallied during the final hour of trading to close the day down modestly.
A good June ISM Non-Manufacturing PMI helped stocks rally Tuesday as markets ignored more weakness in European bank stocks (an important European bank index broke to multi-year lows), and the S&P 500 rallied and recouped almost all of the Tuesday declines. Thursday stocks basically drifted sideways ahead of the jobs report, as a drop in oil to one-month lows helped offset more positive economic data (good jobless claims) and a good earnings report from PEP.
Then, stocks exploded higher Friday as the blowout jobs report combined with a lack of selling in bonds and no rally in the dollar created a short squeeze higher that built on itself throughout the trading day amidst low volumes. Stocks moved steadily higher throughout the morning and afternoon, and traded to multi-month highs, closing just below the all-time high.
Trading Color
Cyclical sectors outperformed last week, but that was due almost entirely to Friday’s big rally, which came on low volumes and consisted of faster money managers chasing stocks higher via higher-beta cyclicals. Not to pooh-pooh the rally, but it didn’t come on strong volumes or with a lot of conviction.
From an internals standpoint, easily the biggest question facing advisors and investors over the next few weeks will be whether we see a large rotation out of defensive/yield-oriented sectors (utilities, staples, REITs) and into cyclicals (banks, materials, consumer discretionary). There certainly was some of that on Friday as cyclical sectors did outperform, but it was not nearly as big as it could have been given how “overbought” most people think utilities/staples and REITs currently are.
In fact, we were actually relatively impressed with the performance of consumer staples (XLP/FXG) on Friday, as given their recent outperformance we could have easily seen outright declines in both those sectors following that strong jobs report. To that point, there will be a lot written about a potential massive rotation out of defensive sectors and into growth over the coming weeks, but until we see a material break lower in the belly and long-end of the Treasury curve, the income provided by staples, utilities, REITs and other defensive sectors will remain critical to outperforming in a choppy market.
On the charts, the S&P 500 broke through several levels of resistance and nearly notched a new intra-day high—2134 is now the next near-term resistance level while support sits lower at 2100.
Bottom Line
Two and a half weeks ago the S&P 500 plunged temporarily below 2000 on Brexit fears, but in less than three weeks the market totally recouped those losses and traded to near-18-month highs. Yet despite all this whipsaw activity, the outlook for stocks has remained largely unchanged, and the bull and bear arguments remarkably static.
So, despite the rising chorus of optimism (which is largely based on very resilient price action) we remain generally cautious on stocks as fundamentals have not materially improved, and because of that we would not be chasing markets at these levels and would resist adding significant capital into stocks broadly, or re-adjusting allocations into higher-growth/cyclical sectors.
Looking at the bull’s argument, it has been bolstered by strong data so far in June, but with unknown Brexit effects looming, any well-reasoned bull is still solely relying on the $130 2017 S&P 500 EPS to justify allocating new capital to stocks. That’s the same argument we’ve had since April. And, in the meantime, the dollar is higher (which will weigh on earnings in the coming quarters) and oil looks heavy. To boot, if the bulls are right and we see a 17X $130 number, that’s only 2210 on the S&P 500, which is less than 4% from current levels. 2000 (which we hit less than three weeks ago) is now about 6% from current levels, so the risk/reward is not attractive.
Now, to be clear, I’m not advocating shorting stocks or selling everything. This tape is strong and that must be respected. But, from a “what do we do now” allocation standpoint, we are staying relatively unchanged in our proprietary accounts. We are not materially adding more cash to stocks, nor are we rotating out of defensive sectors and into cyclicals like materials or consumer discretionary.
Looking at other assets, the markets continue to send “Caution” signals. Treasury yields remain near all-time lows, the pound remains weak and Brexit is not “over” as an influence, the 10’s-2’s Treasury yield spread hit greater than 10-year lows last week while gold remains elevated and European (especially Italian) banks remain under pressure. Again, the odd man out in this cross asset analysis is US stocks, which are just off all time highs, so either the US stock market is “right” and everything else is wrong, or stocks are simply pricing in a very optimistic scenario right now. Regardless, despite the optimism we remain cautious.
5 Macro Risks Keeping Stocks Down
/in Investing/by Tom 2Markets by their very nature are risky, but sometimes the macro risks are bigger and more dangerous than the bulls can handle. As we kickoff 2015, I see five big macro headwinds facing stocks—headwinds that are likely to limit upside at least in the near term.
In order of near-term importance, they are: 1) What will ECB QE look like? 2) Can oil stabilize? 3) Will we have another “Grexit” scare? 4) Is there really a global deflation threat or is it just oil? and 5) When will the Fed start to tighten and how will markets react?
Of the five, the first four are almost equal in importance with regards to what stocks do over the coming weeks. And, it’s important to note that European QE concerns now have trumped (or equaled) oil contagion worries as the near-term leading indicator for stocks. This was made evident Friday when articles in Bloomberg and Reuters were largely responsible for the drop in stocks (it wasn’t the jobs report).
Keep an eye on the WisdomTree Europe Hedged Equity ETF (HEDJ), a proxy for European stocks, as this fund’s direction will betray how the market assesses those concerns.
It’s key to realize, though, that beyond the very short term, none of the above should be materially negative influences on stocks.
The ECB may disappoint with initial QE, but the bottom line is the ECB knows it has to expand its balance sheet and provide more stimulus, which is bullish for European stocks over the coming months and quarters.
While we haven’t likely seen the low tick yet, oil appears to be trying to stabilize, as prices at these low levels will likely start to have an impact on marginal producers (so the pace of declines should slow), which is what is important from an “oil contagion” standpoint. The global “deflation” scare is mostly linked to oil prices so when they stabilize, so will inflation statistics. Third, the “Grexit” story is likely overdone (the chances of Greece leaving the EU remain very slim, and we know that from the bond markets).
Finally, the concern about the FOMC raising interest rates is a problem for the April time frame (as we approach the potential June “lift off” in the cost of capital).
The point here is that we are likely to see more near-term volatility until the events above get resolved, but I would view any material dip below 2000 in the S&P 500 as a buying opportunity in domestic cyclicals (banks, retailers and tech specifically) and continue to view European market weakness as offering fantastic longer term entry points.
Bottom line: The near term may be bumpy, but we see no reason to materially alter equity allocations.
A snippet from February 25th
/in /by Tom 2February 25, 2013
Equities
Market Recap
Stocks suffered their first weekly decline of 2013 last week as concerns about central bankers maintaining extraordinary accommodation and the pace of global economic growth weighted on stocks. The S&P declined .4% last week and is up 6.27% year to date.
Stocks traded flat for the start of last week on little new news, but Wednesday afternoon sold off hard after perceived “hawkish” Fed minutes provided the excuse for the correction everyone has been looking for.
The selling pressure continued through Thursday after economic data from Europe was surprisingly disappointing, and concerns rose that the Chinese might be forced to start tightening monetary policy to help cool and overheating property market.
Despite any real, positive, news Thursday, however, the S&P 500 held the 1500 level after briefly falling below it intra-day, and that support holding led to the bounce in the market Friday. But, there was no real “catalyst” for the bounce and it was little more than just an oversold rally into the weekend (and was not a big “buy the dip” response that might make you think the decline is over).
Sign up now for a FREE TRAIL
Don’t Forget About the DOW
/in Investing/by Tom 2Interestingly, the Dow was a big outperformer on the day (up .76%), and usually when that happens there is one stock that is up several percentage points that skews the average. Interestingly, that was not the case on Monday, as the strength in the Dow was evenly spread across many of the index components (TRV, The Travelers, was the best performing stock in the index up just 1.79%).
The Dow is now up 5.76% for the year, about half of the S&P 500. The reason for this underperformance has to do with the sectors that have rallied the most year to date (Tech and Financials) which are more heavily weighted in the S&P than in the Dow (plus the Dow doesn’t have AAPL).
But, the outperformance today should be noted. If we are heading into a period of concern/weakness in the markets, the sturdy, somewhat stodgy, industrial companies in the Dow, with strong cash flows, good yields, and decidedly less economically sensitive businesses, will outperform.
If investors are concerned about the market trading like it’s 2011, then perhaps it’s helpful to look at what worked in 2011. Keep in mind, in 2011 the Dow finished up 5.5%, while the S&P was flat, and the NASDAQ fell 1.8%.
One of the things traders are constantly monitoring is internals of an index or market, for clues about the strength or weakness of that market beyond what the simple headline numbers say.
That is why investors and trader monitor which sectors are rising and falling, because it can give insight into the “health” of a market rally.
For instance, if you have a market rallying but defensive sectors like utilities or consumer staples are leading the rally, that’s not a good thing. The reason is because those defensive sectors outperform when the economy isn’t growing or people aren’t confident about the direction of a market (they are both economically insensitive—people need electricity and basic consumer goods like razors regardless of whether the economy is growing or expanding) . . .
The above is an excerpt from the Sevens Report. To read the entire article and to receive daily commentary on all major markets and market moving economic and geo-political events, sign up today to request a free 2-week trial of the Sevens Report.
Address
4880 Donald Ross Rd., Suite 210
Palm Beach Gardens, FL 33418
info@sevensreport.com
Phone
(561) 408-0918


