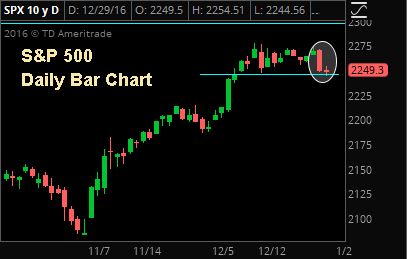
Here is an excerpt Stock Market Update from The Sevens Report. Stocks rallied in quiet trade to start the final week of the year yesterday, as the Nasdaq reached a new all-time high. The S&P 500 gained 0.22% on the day.
Futures were flat early yesterday, but once the bell rang stocks jumped higher out of the gate thanks to economic data that showed an increase in home prices and a spike in consumer confidence.
But with attendance so low between Christmas and New Year’s holidays, and as Hanukah continues, the rally failed to gain any traction and the benchmark averages began to slip from early highs into the lunch hour.
News flow remained extremely quiet, volumes were down and attendance was thin, which allowed stocks to continue to bleed lower into the afternoon until they closed basically in the middle of the day’s trading range.
Technically speaking, the Nasdaq composite hit new highs; however, Dow 20,000 remained elusive for another day despite a run to within 20 points of the psychologically significant level.
Trading Color
Yesterday was slow from both a macro and micro standpoint, as both index and sector movements could best be characterized as drifts. The Russell 2000 and Nasdaq both outperformed the S&P 500, but only slightly, up 0.5% to the S&P 500’s 0.22%.
Internally, the rally was broad as all nine SPDRs we track finished higher, although none came close to rising more than 1%. Basic materials and tech were the two outperformers, up 0.5% and 0.45%, respectively. Materials
were up on the general lift in the commodity complex, while tech rose thanks to preliminary indications of strong holiday sales. AMZN in particular rallied more than 1.5% on reports of strong Amazon branded product sales (Alexa in particular). NFLX also was nearly 2% higher on news of strong holiday subscription sales.
More broadly, there was slight cyclical outperformance yesterday as consumer staples and utilities finished basically unchanged on the day while the aforementioned materials and tech sectors outperformed. But again, the moves were minimal and can be chalked up to random trading noise.
Bottom line, Tuesday was a quiet day in the markets, and with a barren calendar looming for the remainder of the week we can expect more of the same going forward.
Bottom Line: 4 Events To Watch in Q1 2017
In Monday’s issue, I pointed out four policy errors that could adversely affect markets in 2017. With that in mind, I wanted to point out specific events and dates that will give us color on those potential policy errors.
To a point, this is a preliminary catalyst list for Q1 2017, although obviously we will be adding to it as the weeks go by. As we start 2017, though, these are four key dates/events to watch.
1) Trump’s Policies – Will They Meet Very Lofty Expectations (Jan. 20)? Don’t be surprised if we see a “Buy the president-elect, sell the president” market reaction in 2017, as investors could book profits once Trump assumes office. That’s because the single biggest question for markets is whether the actual policies put forward by the new government will meet the very lofty market expectations, and there is serious risk of a disappointment.
We’ll be focused on leading indicators that will tell us whether these policies look likely, because if they don’t, stocks could drop sharply after the inauguration.
2) Fed Meeting (Jan. 31). It’s not a coincidence the hawkish December Fed meeting basically arrested the post-election rally. By the time the January Fed meeting occurs, we’ll have a lot more information on inflation and growth, and it’s entirely possible that the Fed signals another rate hike is coming. If that happens, the 10-year Treasury yield could surge to 3%, and that will hit stocks, regardless of what Trump is doing.
3) Semi-Annual Currency Report (March/April). What if Trump starts a trade war with China? I’m not saying it’s going to happen, but the market is so enamored with potential pro-growth policies that it’s largely ignoring the fact that Trump wants to take a hardline stance on trade. Last week, Trump appointed Peter Navarro, author of the book Death by China, to head a new trade council.
If the Treasury Department labels China a currency manipulator in this Currency Report, automatic tariffs are imposed and a trade conflict could easily ensue.
4) Fed Meeting, (March 15). At this point, we’ll know a lot more about the policies coming out of Washington, and if we’re going to see a lot more fiscal stimulus, then Yellen herself has said the Fed will react with higher rates to prevent inflation.
This March Fed meeting is the first of 2017 with an updated “dot plot,” so if the Fed wants to communicate more hikes in 2017, this is the first opportunity to do so. That will send the dollar and bond yields sharply higher, which will be a headwind on stocks.
 Markets lost a bit of momentum midday as politics interjected into yesterday’s trade (a theme we should all get used to in 2017). Trump’s tweet about GM (he mentioned border taxes) helped stoke some worries about trade issues for 2017 (although the announcement that Ford was keeping a plant in the US was met positively). The Stock Market drifted lower on general digestion, and hit the lows for the day up just 7 points in the S&P 500. However, stocks bounced off intraday support at 2245 and rallied during the final 30 minutes to finish with solid gains.