Posts

FOMC Takeaways (Where’s the Positive Catalyst Now?)

What’s in Today’s Report:

  • FOMC Takeaways – No Discernable Positive Catalysts for Stocks
  • Why This Fed Isn’t Good at Communication
  • Jobs Report Preview
  • Oil Market Update

Futures are tentatively bouncing from yesterday’s late sell off as markets digest an imminent U.S./China trade deal, mixed economic data and the Fed meeting.

Multiple press reports yesterday implied a U.S./China trade deal could be completed next Friday, with the 10% tariffs on 250B in goods immediately reduced.  This meets current market expectations and is already priced in, so there was no rally on the news.

Economic data met low expectations overnight as the EU Manufacturing PMI rose slightly to 47.9 vs. (E) 47.8, but that’s not moving markets.

Today we get a few notable economic reports via Jobless Claims (E: 215K), Productivity and Costs (E: 1.9%, 1.8%) and Factory Orders (E: 1.5%), but none of those should move markets.  Instead, with no major events scheduled for today, traders will be focused on whether the S&P 500 can hold yesterday’s low (2923).  If that support is fails than look for selling to accelerate.

Earnings Season Takeaway (Mild Positive)

What’s in Today’s Report:

  • Earnings Season Early Takeaway (Mildly Positive)
  • Sector Winners From a U.S./China Trade Deal Announcement (It’s Coming Any Day Now)
  • EIA and Oil Market Update

Futures are little changed following a generally quiet night as earnings remain in focus.  Economic data was sparse overnight and isn’t moving markets.

Results after hours Wednesday were good as FB and MSFT both beat estimates, although that’s being offset partially by ugly MMM results this morning.

Today there are two notable economic reports, Durable Goods (E: 0.8%) and Jobless Claims (E: 209K) and it’ll be important to see some sort of stabilization in business spending via Durable Goods.

But, the real focus today will remain on earnings, as we get several important reports.  If numbers are good in aggregate, this rally can continue.  Some earnings we’re watching include – Pre-Open: UPS ($1.42), MMM ($2.50), MO ($0.92).  After the Close: AMZN ($4.72), INTC ($0.87), SBUX ($0.56).

Commodities Update, August 22, 2017

The Sevens Report is everything you need to know about the markets in your inbox by 7am, in 7 minutes or less. Start your free two-week trial today and see what a difference the Sevens Report can make.

Commodities were mostly higher yesterday as gold continued to benefit from risk-off money flows and a weaker dollar, which also propped up copper futures. Meanwhile, crude oil bucked the trend and gave back most of Friday’s rally. The benchmark commodity index ETF, DBC, fell 1.21% thanks to he declines in energy futures.

Yesterday’s pullback in oil was a textbook retracement of Friday’s very “squeezy” rally. Shorts that were run out of the market late last week repositioned yesterday morning, which influenced the heavy trading that was largely dictated by technicals. WTI futures fell 2.22% on the day.

Friday’s big rally essentially created a “gap” in the market as the bulk of the move occurred in less than an hour, and on very light volume. That set things up for a reversal, and because newswires were very quiet yesterday, algos and technical traders took control of the market and largely “filled the gap” as we ended the day near where Friday’s rally began.

As far as the longer-term trend in oil goes, yesterday’s session was rather insignificant. The market remains in a broad, sideways range with the $50 mark continuing to act as a stubborn resistance level.

Fundamentally, the OPEC/NOPEC meeting in Vienna was anticlimactic. The previous extraordinary meeting was a non-event as well, and the market is beginning to shrug off OPEC-related headlines more and more as the cartel has been largely ineffective in recent months.

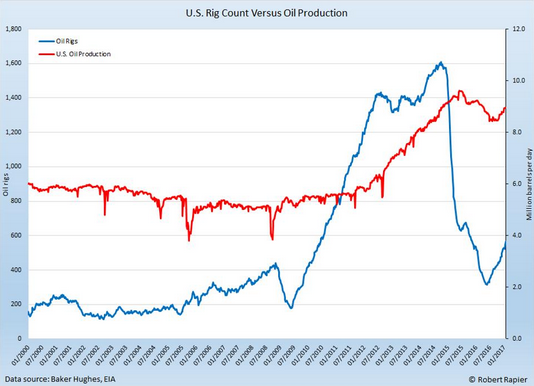
The oil market remain bearish for now, as US production continues to grind higher and OPEC has so far failed at trying to offer material support to the market through their policy decisions. Looking ahead, the $50 mark in WTI is a very important technical and psychological resistance level that will not likely be violated in the absence of a legitimate bullish catalyst.

Natural gas rallied 2.42% yesterday as the market continues to show signs of life in the late summer. There was no real catalyst for the move yesterday, but nat gas is continuing to show signs of putting a bottom in and forming support in
the $2.80-$2.90 area.

Looking ahead, the bulls have their sights set on reclaiming the $3.00 mark, and a close above would be a bullish development on the charts. That would match the supply side fundamentals showing a potential long-term shift of supply levels turning lower.

In the metals, the weaker dollar was the primary influence on the market yesterday, as gold rallied 0.39% and copper rallied 1.36%. Gold continued to catch a bid from the cautious feel in the market after last week’s sharp pullback in stocks, but futures failed to close at a new high and above the $1300 mark despite rallying through the important resistance level briefly in Friday trade.

For now, we remain cautious on gold as the technical outlook is rather cloudy. If, however, bond yields break- down further (more on that in the currencies and bonds section) then gold will surely have the support to break out through $1300 and begin a new uptrend.

Copper continued to grind higher yesterday with futures hitting the highest level since late 2014. With the price action in gold and the bond market both flashing a warning sign for risk assets, copper continues to flash a positive signal for the global economy.

Looking ahead, the path of least resistance is still higher for copper, which is a positive for the global economic outlook and risk assets. Yet, the biggest thing to watch with regard to the rally is the dollar, as a reversal back higher in the buck could significantly damage the uptrend in all metals.

Time is money. Spend more time making money and less time researching markets every day. Subscribe to the 7sReport.com.


Oil Outlook: Getting More Bearish, March 15, 2017

Oil Rig - Oil Report was BearishWhy the Monthly OPEC Report Was Bearish Oil

An excerpt from today’s Sevens Report—get a free 2-week trial of the report with no commitments.

Oil remains the big story, as its early morning sell-off to multi-month lows prompted a pullback in stock futures, and ultimately the major US equity indices opened lower. WTI futures finished the day down 1.43%, only slightly above where they opened ahead of the late-November OPEC meeting, where members agreed to collectively cut output.

OPEC released its monthly oil market report yesterday, and the big catalyst in the data was a self-reported increase in February oil production by the de facto leader of the cartel, Saudi Arabia. According to direct communication, Saudi Arabian oil output rose 263.3K b/d to 10.01M b/d. The dip below the psychological 10M mark in early 2017 helped futures stay afloat above $50, as Saudi Arabia was showing their commitment to price support by cutting below their allotted quota (which in fairness they are still below). While data gathered by secondary sources showed another drop of 68.1K b/d to 9.80M b/d in Saudi production, the markets focused on the bearish direct communication data, as it suggests that Saudi Arabia’s commitment to oil cuts may be becoming exhausted.

Another notable takeaway from the release was that OPEC only projects that US oil supply will grow at 340K b/d in 2017. Still, at the current pace (which we will admit does not seem sustainable through the medium term), US producers have already brought 318K b/d online in 2017. Today’s EIA report very well could show an increase through that annual expected rise of 340K b/d.

Bottom line, the rapid increase in US production in recent months has been the biggest long-term headwind for the oil market, as it has offset the efforts of the global production cut agreement while simultaneously causing angst within the ranks of OPEC (namely the Saudis) as they start to see market share slip away.

Without the full commitment of Saudi Arabia to the global production cut agreement, the deal loses a lot of its luster, as they are the key player who has always taken on the bulk of the cuts and taken the near-term hit in market share for the longer-term benefit of the entire cartel. Meanwhile, “compliance cheating” by other members is historically high, and the chances that compliance remains as high as it is right now if Saudi Arabia begins to increase production are essentially zero.

The Sevens Report is in your inbox by 7am each morning. Save time each morning by getting in-depth and jargon-free analysis of stocks, bonds, commodities, currencies, and economic data. Sign up for your free 2-week trial.

Oil Market Internals Confirm Our View of “Lower-for-Longer” Price Environment, February 24, 2017

This is an excerpt from today’s Sevens Report. Sign up for your free two-week trial to get everything you need to know in your inbox, by 7am in 7 minutes or less.

We have recently been monitoring the calendar spreads and term structure of WTI crude oil futures with a little more attention, as there have been notable developments.

As a refresher, a calendar spread is simply the difference in price between two contracts with different expirations. For example, contracts with a December ’17 expiration are currently trading at a roughly $1.00/bbl premium to contracts expiring in December ’18 (this is called an inverted market, or backwardation, and is not typical in energy markets). Normally, back-month con-tracts are more expensive than front-month contracts to reflect the price of storage and other variables. Such a structure is called normal contango.

The trend is long-term bearish oil.

The trend is long-term bearish oil.

Over the last week or two, calendar spreads have surged, which would be considered very bullish in normal market conditions like we had late last year when OPEC announced their agreement to cut production with several large NOPEC producers. After that announcement, the entire WTI expiration curve rallied on the speculation of that bullish development in the supply-demand fundamentals with front-month contracts out-performing back months (calendar spreads rallied, con-firming the move in active-month futures).

In the current case, the strength in the calendar spreads has been the result of weakness in back-month contracts like December ’18. Think about the simple equation a – b = c (calendar spread). If “a” (Dec ’17) and “b” (Dec ’18) are both increasing, but the pace of a’s increase is faster, “c” will be positive (so the calendar spreads would be rallying, which is bullish). Right now, “c” is rising because of a faster decline in “b” than in “a” and that is far less of a reason to be optimistic on this current, sluggish trend higher in oil prices.

Stepping back, this development in the calendar spreads confirms what we have been saying, and that is we remain in a lower-for-longer price environment in the energy market.

The logical reason for a faster decline in back-month contracts such as December ’18 expiration suggests that US producers are hedging out future production for wells they have either just brought online or are in the process of bringing online. And this concept supports our idea that US production has not only bottomed, but has begun a cyclical move higher.

Bottom line, that trend is long-term bearish oil for two reasons. First, the obvious fact that rising US output will offset the efforts of the production cut agreement overseas is supply side bearish. Second, OPEC producers are not likely going to be comfortable with the idea of losing market share to the US again (after all, that is the reason they switched to “full-throttle” policy back in summer 2014, which led to the near-80% plunge in oil prices over the subsequent 18 months). The more market share OPEC loses to the US the more likely their compliance to individual quotas will begin to fall, which is very bearish for prices as that is what this current recovery into the $50s is fundamentally based on.

Looking ahead, we could very well see a continued run higher towards our initial target of $57.50, or to our secondary target of $60/bbl, as optimism surrounding OPEC compliance remains elevated. The longer-term outlook is not so bright, and the low $50s will likely remain a “magnetic” level for WTI futures.

The Sevens Report is the daily market cheat sheet our subscribers use to keep up on markets, seize opportunities, avoid risks and get more assets. Sign up for a free 2-week trial today.

The Oil Market: Then and Now

The Oil Market: Now and Then

We have included in today’s report a chart that was featured in a Forbes article yesterday regarding the two main influences on the oil market right now: rising US output and OPEC/NOPEC production cuts. At first look, the chart suggests that using hindsight as a gauge, US production lags the rise in rig counts which supports the argument that US production will not rise fast enough to offset the OPEC/NOPEC efforts. But we think that argument is flawed and here is why.

During the last aggressive expansionary phase for US oil production (rising US rig counts/increasing output) which lasted from 2009 to 2014, oil prices were wavering between about $80 and $110/bbl. The correlation between the pace of rig count growth and production growth was rather low as you can see by the difference between the slopes of the two lines in the chart. The likely and simple reason for that low correlation is the fact that there was a lot wild cat drilling, thanks to a surge in industry investment, that turned out to be unsuccessful.

In today’s lower price environment, efficiency is key and exploratory drilling, especially in unconventional areas, is at a minimum while producers focus their time, efforts, and investments on reliable sources of oil with considerably lower lift costs. If this is indeed the case as we believe it is and a good portion of the increasing rig counts that are being reported by BHI are actually DUCs (Drilled but Uncompleted wells) in proven areas, then the relationship between rig counts and production should have a tighter correlation than it did 5-10 years ago.

Bottom line, the fundamental backdrop of the energy market is different right now than it was between 2009 and 2014 and because investment in energy is much lower while the industry remains focused on efficiency, we are more likely to see a tighter correlation between rising rig counts and rising US production which would result in a faster pace of production growth. That in turn would offset the efforts of global producers who are trying to support prices and as a result, leave us in a “lower for longer” oil environment.