Posts

Four Steps to a Bottom

What’s in Today’s Report:

  • Technical Update
  • Four Steps to a Bottom

US futures are in the red again this morning although there is again no clear reason why while overseas shares traded mostly “ok” overnight amid mixed economic data.

Japanese PMI Manufacturing Flash beat (53.1 vs. E: 52.6) helping the Nikkei rally but EU data was on the soft side.

As far as US economic data goes today, there are two reports on the housing market this morning: FHFA House Price Index (E: 0.3%) and New Home Sales (E: 625K) while the more important release to watch will be the PMI Composite Flash (E: 54.1) due out shortly after the open.

The Fed speaker circuit also remains busy with Bostic (10:00 a.m. ET, 2:00 p.m. ET), Bullard (11:30 a.m. ET), and Mester (12:30 p.m. ET) all speaking during the Wall Street session today.

Lastly, and likely most importantly for stocks right now, there are a slew of earnings reports today. A few notables include: BA ($3.51) and T ($0.93) ahead of the open and MSFT ($0.96) and V ($1.20) after the close.

Updated Market Outlook Post Pullback

What’s in Today’s Report:

  • Putting the Pullback In Context (We’ve Seen Something Similar Twice This Year)
  • Weekly Market Preview (All About Earnings and Data)
  • Weekly Economic Cheat Sheet (Market Needs a Confidence Boost)

Futures are moderately lower following a generally quiet weekend, as markets digest Friday’s bounce.

Nothing outright negative occurred over the weekend to cause the resumption of selling. But, there was no improvement in any macro headwinds either and as such markets are digesting Friday’s gains.

There were no notable economic reports overnight.

Today focus will turn towards economic data and we get two important reports: Retail Sales (E: 0.6%) and Oct. Empire Manufacturing Survey (E: 19.3).  Strong readings will give the market a needed boost of confidence as they’ll remind investors the economic remains strong.

On the earnings front, activity picks up starting tomorrow but there are two notable reports today:  BAC (E: $0.62), SCHW (E: $0.64).

Is This the Fed’s Fault?

What’s in Today’s Report:

  • Selloff Update (Some Positive News Yesterday)
  • If This The Fed’s Fault?
  • Two Economic Canaries in the Coal Mine

Futures are rebounding as global markets bounce following solid economic data and confirmation of the Trump/Xi meeting at the G-20.

Economic data was solid overnight as Chinese exports beat estimates, rising 14.5% vs. (E) 8.2%, while Eurozone Industrial Production rose 1% vs. (E) 0.5%.  Both numbers are helping to improve sentiment.

Today we get bank earnings and JPM already released results and beat estimates, while we wait for WFC (E: $1.17) at 8:00 a.m.    Economically we get Consumer Sentiment (E: 99.5) and there are two Fed speakers, Evans (9:30 a.m. ET) and Bostic (12:30 p.m. ET) but none of that should move markets.

Instead, we can expect markets to continued to digest the recent pullback.  The tech sector showed some hints of stabilization yesterday but it’ll need to rally if we’re going to get a material bounce in stocks today.  Bigger picture, strong earnings from industrial and multi-nationals (which won’t be possible till next week at the earliest) remains the “fix” to this market pullback.

Jobs Report Preview

What’s in Today’s Report:

  • Why the Market is Vulnerable to a Short Term Pullback
  • Jobs Report Preview

Futures are slightly higher following a generally quiet night of news.

There was no new trade news overnight so markets continue to wait for the administration decision on the 200 billion in new Chinese tariffs (it can come any day now).

Economically the only notable report was German Manufacturers’ Orders, which missed estimates (-0.9% vs. (E) 2.1%).

Today markets will be watching the news wires for any tariff related headlines.  But, outside of that, we get thee notable economic reports, the most important of which is the ISM Non-Manufacturing Index (E: 56.8).  On the employment front, we also get the ADP Employment Report (E: 182K) and Jobless Claims (E: 213K) and both reports should show continued strength in the job market.

Read the full report here

Weekly Market Outlook

What’s in Today’s Report:

  • Weekly Market Outlook

Futures are marginally higher this morning and global markets were mostly flat overnight after a very quiet and uneventful holiday weekend as focus turns to data this week.

Economically, Eurozone PPI was solid at 4.0% YoY, but most of the rise was due to energy prices and core inflation levels remain slow but steady in the EU.

Energy prices are notably higher this morning due to Tropical Storm Gordon’s near term threat to Gulf oil operations.

Today, focus will be on economic data early: ISM Manufacturing Index (E: 57.6) and Construction Spending (E: 0.4%) while there are no Fed speakers scheduled to speak.

Beyond data, investors will largely be focused on trade relations this week, more so with China but negotiations with Canada will also be important.

The dollar has been a good, inverse indicator for investor sentiment towards trade and it is handily higher this morning. If the dollar strength continues, it will be hard for stocks to continue last week’s gains this week.

To read the full article Go Here

Six Charts That Explain This Market from the Sevens Report

The Sevens Report is everything you need to know about the markets, in your inbox before 7am, in 7 minutes or less. Sign up now and get a free two-week trial.

Below you’ll find six charts, spanning asset classes and economic data.

The charts are divided up into two groups.

Group 1 is comprised of four charts that explain why stocks have rallied so nicely in 2017, and why, in the near term, the trend in markets is still higher.

Group 2 is comprised of two charts that look into the future, and show that despite a bullish set up right now, there are real, serious reasons to be worried about how long this rally can last. Point being, these indicators are telling you not to be complacent!

Group 1: Why Stocks Have Rallied

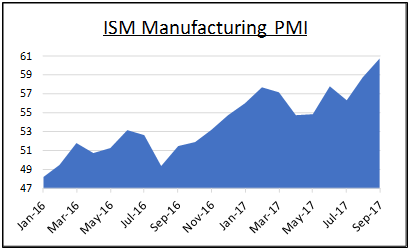
Chart 1:  Economic Data 

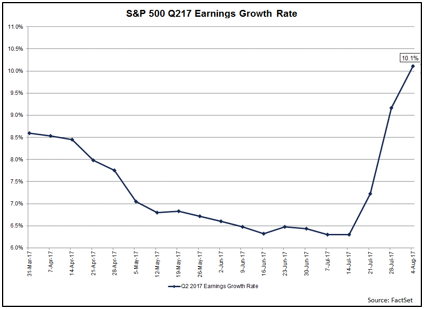
Chart 2:  Earnings Growth  

Earnings and Economic Data – The Unsung Heroes of 2017

We have said since the early summer that an acceleration in economic data and earnings growth have been the unsung heroes of the 2017 rally.

And, as long as both of these factors continue to trend higher, that will underpin a continued rise in U.S. stocks, regardless of noise from Washington, North Korea, Russia, etc.

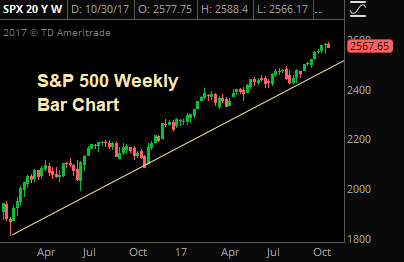
Chart 3:  S&P 500 

The Trend Is Your Friend

The trend in stocks has been relentlessly higher since early in 2016, and the S&P 500 has held that trend line through multiple tests.

Bottom line, the technical outlook on this market remains powerfully positive.

Chart 4:  Commodities (Oil & Copper)

There are few better indicators of global economic growth than industrial commodities, and two or the most important (oil and copper) have been telling us for months that global growth is accelerating.

And, as long as oil and copper are grinding to new highs, that will be a tailwind not just on U.S. stocks, but on global stocks as well.

Group 2:  Risks to This Rally

While the four charts above explain why stocks have rallied and why the outlook remains, broadly, positive, there are still risks to this rally and this market.

Don’t be fooled into being complacent with risk management, because while trends in U.S. and economic growth, earnings and the stock market are all still higher, there are warning signs looming on the horizon.

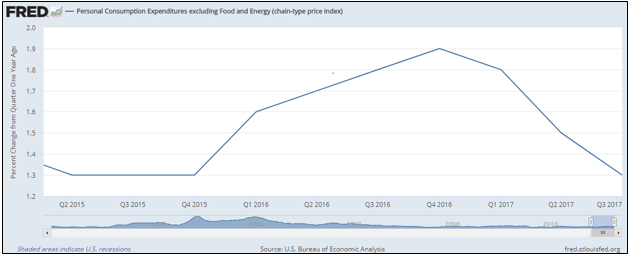
Chart 5:  Inflation (Warning Sign #1)

Non-Confirmation: Why Isn’t Inflation Rising?

Inflation remains inexplicably low, considering that we’re near full employment and global economic growth is accelerating.

And, accelerating inflation remains the missing piece of a true “Reflation Rally” that can carry stocks 10%, 15% or even 20% higher over the coming quarters and years.

But, it’s not just about missed opportunity.

The lack of inflation is a big “non-confirmation” signal on this whole 2017 rally, and if we do not see inflation start to rise, and soon, that will be a major warning sign for stocks, because…

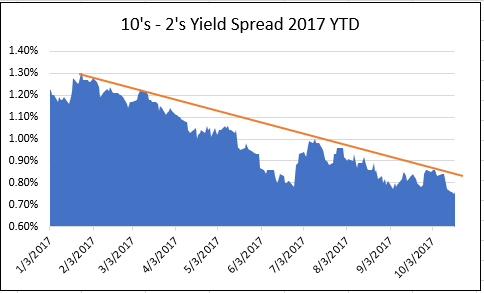
Chart 6: The Yield Curve – Will It Invert?

Yield Curve: Sending a Warning Signal? 

If the outlook for stocks is so positive, then why did the yield curve (represented here by the 10’s – 2’s Treasury yield spread) equal 2017 lows on Wednesday?

Simply put, if we’re seeing accelerating economic growth, rising earnings, potential tax cuts and all these other positive market events, the yield curve should be steepening, not flattening.

So, if this 10’s – 2’s spread continues to decline, and turns negative (inverts) then that will be a sign that investors need to begin to exit the stock market, because a serious recession is looming, and the Fed won’t have much ammunition to fight it.

If I was stuck on a desert island (with an internet connection and access to my trading accounts of course) and could only have one indicator to watch to tell me when to reduce exposure in the markets, this 10’s – 2’s spread would be it – and it’s not sending positive signals for 2018!

Should We Buy Value to Get Growth?, October 3, 2017

The Sevens Report is the daily market cheat sheet our subscribers use to keep up on markets, leading indicators, seize opportunities, avoid risks and get more assets. Get a free two-week trial with no obligation, just tell us where to send it.

At the start of 2017, I incorrectly expected growth sectors of the market to outperform, as I anticipated inflation and economic data to steadily improve as the Fed continued to hike rates.

The latter expectation (Fed rate hikes) has been met, but the former two, until now, have not, as the dip in inflation and growth caused a drop in bond yields and resulted in the outperformance of defensive sectors (not growth/cyclical sectors) so far in 2017.

But things appear to be changing, and while past performance is no guarantee of future results, if we are on the cusp of a “reflationary” rally, then history suggests buying “value” funds will be the way to outperform into year-end.

On the surface, though, this doesn’t make sense. If we are going to see a reflation, won’t “growth” styles naturally outperform given the acceleration in inflation/economic activity?

The answer is “yes,” but here’s the rub: Growth-oriented sectors like banks and energy have massively underperformed this year and are now heavily owned by most value-styled ETFs. Meanwhile, growth-styled ETFs are heavily overweight tech, and stand to underperform in a reflation, just like they did in 2016.

The key here lies in the fund’s sector allocations.

My favorite “growth sector” ETF is actually the iShares S&P 500 Value ETF (IVE), which is allocated as follows: 28% financials, 12% healthcare, 11% energy. So, 40% of the ETF is weighed to sectors (financials and energy) that will surge in a reflationary rally. Conversely, utilities are just 6%, tech is 7% and consumer staples are weighted at 11%.

Up until September, this weighting has caused IVE to lag the S&P 500, but IVE rallied 2.7% in September, more than doubling the S&P 500. Looking further back, in the pro-growth, post-election rally between Nov. 8 and year-end 2016, IVE surged 17% compared to just 9% for the S&P 500.

Point being, lackluster inflation and economic readings in 2017 have created a scenario where outperforming sectors are predominantly “defensive” sectors. But, this big rally has caused these sectors (utilities, staples, super-cap tech) to be significantly underweighted in some value ETFs and mutual funds—and that creates this weird  set up where getting exposure to growth sectors that can outperform in an economic reflation means buying “value” ETFs and mutual funds due to their recent underperformance.

So, as we start the fourth quarter, if you’re reviewing client exposure, don’t forget that “value” funds, if we see a confirmed economic reflation, will provide the exposure to growth sectors we need to outperform.

Food for thought.

Cut through the noise and understand what’s truly driving markets, as this new political and economic reality evolves. The Sevens Report is the daily market cheat sheet our subscribers use to keep up on markets, seize opportunities, avoid risks and get more assets. Sign up for your free two-week trial today and see the difference 7 minutes can make. 

Virtuous vs. Non-Virtuous Reflation Trades, October 29, 2017

The Sevens Report is the daily market cheat sheet our subscribers use to keep up on markets, leading indicators, seize opportunities, avoid risks and get more assets. Get a free two-week trial with no obligation, just tell us where to send it.

Can the economic data support a continued bullish “reflation” trade in the markets? So far, the events of this week (strong Durable Goods, “progress” on pro-growth tax reform) have supported that idea, and that’s why the S&P 500 is sitting at fresh all-time highs.

But, the next seven days will present both risks and opportunities for the reflation trade to accelerate, or falter.

In yesterday’s issue, I referenced a “virtuous” reflation trade—one that is positive for the broad stock market and especially positive for our reflation basket.

In this scenario, 1) Inflation firms and gradually accelerates, 2) Growth accelerates modestly, 3) Central banks gradually raise rates but not at a pace that unnerves the stock market or sends yields too high, to quickly.

That’s what we’ve seen from the data starting almost three weeks ago with the Chinese inflation numbers
(followed by firm British CPI and US CPI). That’s why stocks have rallied, and it’s why our reflation basket has outperformed.

Conversely, there is a “non-virtuous” reflation we need to be aware of. In this scenario, growth and inflation accelerate too quickly, and markets begin to price in a more hawkish Fed, ECB and BOE.

In this scenario, while banks and other ETFs listed in our reflation basket would either outperform on an
absolute basis and/or on a relative basis, the rest of the market might not fare as well (particularly tech).

This is what we saw in June, where the declines in tech weighed so much on the market that it began to “suck in” other, more cyclical sectors. This is the negative side of reflation we need to watch for in the weeks ahead.

Bottom line, the market now again nearing a tipping point, and the data today and next week will go a long way to telling us 1) Whether we’re seeing a legitimate reflation, and 2) Whether it’s virtuous (bullish).

Cut through the noise and understand what’s truly driving markets, as this new political and economic reality evolves. The Sevens Report is the daily market cheat sheet our subscribers use to keep up on markets, seize opportunities, avoid risks and get more assets. Sign up for your free two-week trial today and see the difference 7 minutes can make. 

Green Shoots of A Global Reflation, September 13, 2017

Are We Seeing “Green Shoots” of A Global Reflation?
• Chinese August CPI rose 1.8% yoy vs. (E) 1.7% yoy.
• British Core CPI rose 2.7% vs. (E) 2.5% yoy.

Takeaway

Are there “green shoots” of inflation? I reference the Bernanke comments regarding economic growth here, because very quietly we’ve seen two better-than-expected inflation numbers in two big economies (technically three if you count the uptick in Indian CPI, although that’s not widely followed).

August Chinese CPI beat (it came out Friday but couldn’t be priced in until markets opened on Monday) but it was the big uptick in core British CPI that saw the market extend the rally on Tuesday.

So, the logical question, given these two surprise beats is, “Will US CPI also surprise markets?”

The inclination is to believe in the trend, but to be clear, higher Chinese and British CPIs have no real bearing on US CPI—so strong numbers in those two reports don’t increase the likelihood of a strong CPI number.

But, if it comes, expect some potentially big market moves across Treasury yields, the dollar, and in stock
sector trading (banks and cyclicals will scream higher while defensives, including parts of tech, will likely badly lag). But again, that will depend on tomorrow’s number.

From a market standpoint, looking at the effects of the strong Chinese and British CPI, the clear ETF winner is…(withheld for subscribers only—unlock specifics and ETFs by signing up for a free two-week trial).

I continue to believe that an economic reflation (better growth, higher inflation) remains the key to a sustained US and global stock rally. And while two numbers don’t make a trend, they were the first positive surprises we’ve had on inflation in months, and we think that’s potentially very important (if it continues).

Cut through the noise and understand what’s truly driving markets, as this new political and economic reality evolves. The Sevens Report is the daily market cheat sheet our subscribers use to keep up on markets, seize opportunities, avoid risks and get more assets. Sign up for your free two-week trial today and see the difference 7 minutes can make. 

Harvey’s Market Impact, August 29, 2017

The Sevens Report is everything you need to know about the markets in your inbox by 7am, in 7 minutes or less. Start your free two-week trial today and see what a difference the Sevens Report can make.

We got a couple of questions from advisors yesterday about the market impact of Hurricane Harvey, so I imagined you might be getting similar calls from your clients.

So, I wanted to clearly and briefly outline the market impact of the storm.

Macro Impact: Not Much. From a macro standpoint (Fed policy, GDP growth, inflation) Hurricane Harvey won’t have much of an effect. While clearly a significant human tragedy for Houston and Southeast Texas, storms simply don’t have a lasting effect on markets. Katrina and Sandy had impacts on the local economies, but again, the broader macro influence wasn’t big. Harvey does not change our “cautiously positive” stance on markets.

Micro Impact: The more palpable impact of Hurricane Harvey will be on specific market sectors, although I will not provide a list of “winners” given the damage wrought upon Houston and other parts of Texas.

That said, companies that likely will see increased demand due to the storm are: Refiners (HFC, DK), trucking companies (KNX), and equipment rental companies (URI). Unfortunately, there’s not a clean ETF for these sectors, and the only tradeable infrastructure ETF is a global ETF, so I don’t think it’s applicable here.

Companies that are likely to see business decline because of Harvey are: Natural gas and oil E&P companies due to a lower production and lower prices (ETF is XOP), and insurers.

Looking at insurers, the focus there is on property and casualty insurers as they will be the most affected by the storm. The big insurance ETF is KIE which traded down 1% on the news yesterday. But, while the first instinct would be to run from the insurance space, in some ways I view this as a potential opportunity to buy insurers on a dip (if this continues).

First, property and casualty insurers are just 40% of KIE. Yes, there will be more exposure through reinsurance (10.8% of assets), but that still leaves about half the assets of the ETF somewhat insulated from the storm. Additionally, 24% of the exposure of the fund is to the UK, and those should have little exposure to Harvey.

Point being, I’m not saying buy KIE today but I also want to look through the initial impulse to just shy away from the sector entirely. But, over the longer term, being long insurance companies are like betting with the house in a casino—they always win given enough time.

If Harvey creates an unreasonable downdraft in KIE, we will likely allocate capital to it for longer-term accounts. We’ll be watching this one going forward.

Time is money. Spend more time making money and less time researching markets every day. Subscribe to the 7sReport.com.