Posts

Fed Pause Playbook & Powell Preview

What’s in Today’s Report:

  • Fed Pause Playbook
  • Powell Testimony Preview
  • Chart – Return Comparison After the Last Rate Hike Pauses

U.S. equity futures are trading with tentative gains amid a stable bond market following good data out of Europe as focus shifts to Powell’s Congressional testimony today.

The ECB’s latest consumer survey showed a notable drop from 3.0% to 2.5% in three year inflation expectations which is helping bonds stabilize while German Manufacturers Orders came in at 1.0% vs. (E) -0.6%, underscoring a resilient Eurozone economy.

This morning, focus will be exclusively on Powell testimony before the Senate which begins at 10:00 a.m. ET as investors will be looking for any new insight on the pace of future rate hikes (25 or 50 basis point hike this month?) and/or the expected terminal rate (currently priced in near 5.375%). If Powell strikes a hawkish tone, expect volatility in stocks amid a potentially sharp rise in yields.

Looking into the afternoon, there is a 3-Yr Treasury Note auction at 1:00 p.m. ET which should offer some clues to how the bond market digests Powell’s first day of Congressional testimony (a badly tailing auction could further weigh on stocks), while there is one economic report due out late in the day: Consumer Credit (E: $26.4B), but unless the number comes in well above estimates, it should not move markets.

Technical Update: Key Levels to Watch

What’s in Today’s Report:

  • Technical Update:  Key Levels to Watch
  • Value vs. Growth – What Do the Charts Say?

Futures are modestly higher as a soft EU inflation reading is helping to extend Thursday’s rally.

Euro Zone PPI came in much lower than expectations (15% vs. (E) 17.7% y/y) and that’s helping to slightly offset the hot inflation data from earlier in the week.

Economically, Euro Zone and UK Composite PMIs were generally in-line with expectations.

Today the key report will be the ISM Services PMI (E: 54.5).  For stocks and bonds, the best case for this report is that the headline is stable (not much above expectations) while the price indices decline.  If that happens, stocks can extend the rally.

We also get several Fed speakers today including Logan (11:00 a.m. ET), Bostic (11:45 a.m. ET), Bowman (3:00 p.m. ET) and Barkin (4:15 p.m. ET).  If they echo Bostic’s comments from yesterday about the Fed being done with hikes by mid to late summer, that will be a tailwind on stocks.

Economic Breaker Panel: February Update

What’s in Today’s Report:

  • Sevens Report Economic Breaker Panel – February Update
  • January Durable Goods Orders Takeaways
  • Breakout in Natural Gas Futures

Stocks futures are trading with modest gains this morning while Treasury yields are tracking European bond yields higher following stubbornly high inflation data overnight.

Economically, both Spanish and French CPI headlines were hotter than expected, above 6%, which saw European rates markets price in a 4% terminal ECB rate for the first time. Government bond yields across the Eurozone notably rose to multi-year highs.

Looking into today’s session, there are several economic reports to watch including: International Trade (E: -$91.0B), Case-Shiller Home Price Index (-0.5%), FHFA House Price Index (E: -0.3%), and Consumer Confidence (E: 108.5).

Traders will be looking for less signs of stagflation in the data as elevated inflation figures and weakening growth metrics were a headwind for equities last week.

Finally, the Chicago Fed’s Goolsbee (who just succeeded Evans) has his first speaking engagement since taking over the role at 2:30 p.m. ET, and as a voting member of the FOMC, his comments will be closely watched for any new clues about Fed policy plans in the months ahead. A notably hawkish tone, could easily cause another bout of volatility in risk assets this afternoon.

Tom Essaye Quoted in Forbes on February 21st, 2023

‘Damage Is Done’: Stock Market Likely Set For Another Plunge As Economic Warning Signs Abound, JPMorgan Cautions

“Markets are admitting the Fed may not be close to done,” Sevens Report strategist Tom Essaye wrote in a Tuesday note, as stocks sank following worse-than-expected retail earnings. Click here to read the full article.

Tom Essaye Quoted in Barron’s on March 11, 2022

The Dow Fell After Putin Cited ‘Positive Shifts.’ Here’s What Else Happened in the Stock Market Today.

Investors took profits on Friday while they could ahead of the weekend…explained Tom Essaye, founder of Sevens Report Research. Click here to read the full article.


Tom Essaye Quoted in Investing.com on February 3, 2022

Asian Stocks Mixed, Recovery from $250B Meta Wipeout Continues

The looming jobs report is a reminder that expectations for Fed policy are the key influence on this market right now…Tom Essaye, a former Merrill Lynch trader who founded The Sevens Report newsletter, told Bloomberg. Click here to read the full article.

Why Aren’t TIPS Rising?

What’s in Today’s Report:

  • Why Aren’t TIPS Rising?
  • What Could Send 10’s-2’s Closer to Inversion?

Futures are slightly lower as markets continue to digest Wednesday’s Fed decision (50 bps in March or five hikes in 2022) amidst mixed earnings results.

AAPL posted better than expected earnings and the stock was up 3% overnight, but overall results continue to be mixed and that’s contributing to market volatility.

Today’s focus will be on important inflation data and the reason is clear:  If the inflation data is materially stronger than estimates, that will only encourage the Fed to get more hawkish/unpredictable, and that will add to the headwinds on stocks.  The key inflation numbers to watch today are: Core PCE Price Index (E: 0.5%, 4.8%), Employment Cost Index: (E: 1.2%, 4.1%), and the Inflation Expectations in the 10:00 a.m. Consumer Sentiment Index.

We also get some notable earnings today, including CAT ($2.22), CVX ($3.10), SYC ($1.47), and CL ($0.79).  But, barring a major disappointment, they shouldn’t move markets.

Tom Essaye Quoted in TheStar on June 7, 2021

AMC drama exposes risks in index world

For index investing, the appeal is that human decision-making, human emotions are taken out of it. That works all well and good until a stock that is supposed to be…said Tom Essaye, a former Merrill Lynch trader who founded “the Sevens Report” newsletter. Click here to read the full article.

Six Charts That Explain This Market from the Sevens Report

The Sevens Report is everything you need to know about the markets, in your inbox before 7am, in 7 minutes or less. Sign up now and get a free two-week trial.

Below you’ll find six charts, spanning asset classes and economic data.

The charts are divided up into two groups.

Group 1 is comprised of four charts that explain why stocks have rallied so nicely in 2017, and why, in the near term, the trend in markets is still higher.

Group 2 is comprised of two charts that look into the future, and show that despite a bullish set up right now, there are real, serious reasons to be worried about how long this rally can last. Point being, these indicators are telling you not to be complacent!

Group 1: Why Stocks Have Rallied

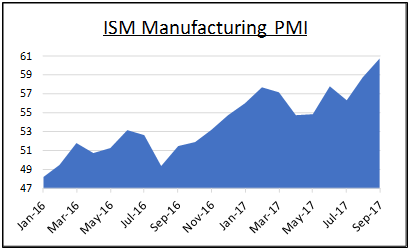
Chart 1:  Economic Data 

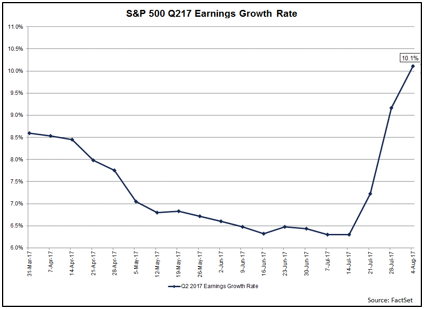
Chart 2:  Earnings Growth  

Earnings and Economic Data – The Unsung Heroes of 2017

We have said since the early summer that an acceleration in economic data and earnings growth have been the unsung heroes of the 2017 rally.

And, as long as both of these factors continue to trend higher, that will underpin a continued rise in U.S. stocks, regardless of noise from Washington, North Korea, Russia, etc.

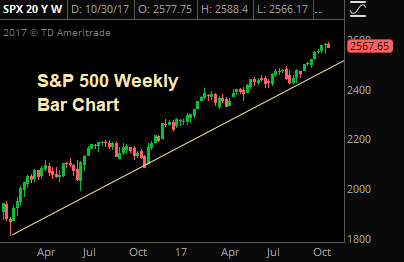
Chart 3:  S&P 500 

The Trend Is Your Friend

The trend in stocks has been relentlessly higher since early in 2016, and the S&P 500 has held that trend line through multiple tests.

Bottom line, the technical outlook on this market remains powerfully positive.

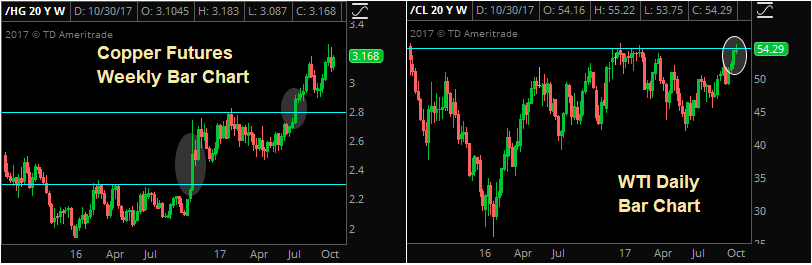
Chart 4:  Commodities (Oil & Copper)

There are few better indicators of global economic growth than industrial commodities, and two or the most important (oil and copper) have been telling us for months that global growth is accelerating.

And, as long as oil and copper are grinding to new highs, that will be a tailwind not just on U.S. stocks, but on global stocks as well.

Group 2:  Risks to This Rally

While the four charts above explain why stocks have rallied and why the outlook remains, broadly, positive, there are still risks to this rally and this market.

Don’t be fooled into being complacent with risk management, because while trends in U.S. and economic growth, earnings and the stock market are all still higher, there are warning signs looming on the horizon.

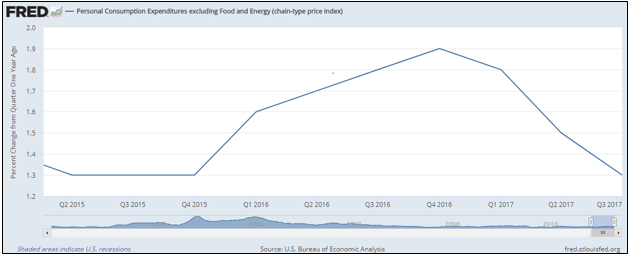
Chart 5:  Inflation (Warning Sign #1)

Non-Confirmation: Why Isn’t Inflation Rising?

Inflation remains inexplicably low, considering that we’re near full employment and global economic growth is accelerating.

And, accelerating inflation remains the missing piece of a true “Reflation Rally” that can carry stocks 10%, 15% or even 20% higher over the coming quarters and years.

But, it’s not just about missed opportunity.

The lack of inflation is a big “non-confirmation” signal on this whole 2017 rally, and if we do not see inflation start to rise, and soon, that will be a major warning sign for stocks, because…

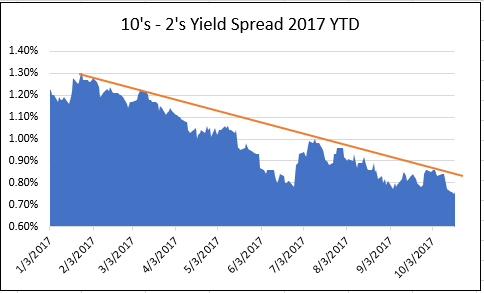
Chart 6: The Yield Curve – Will It Invert?

Yield Curve: Sending a Warning Signal? 

If the outlook for stocks is so positive, then why did the yield curve (represented here by the 10’s – 2’s Treasury yield spread) equal 2017 lows on Wednesday?

Simply put, if we’re seeing accelerating economic growth, rising earnings, potential tax cuts and all these other positive market events, the yield curve should be steepening, not flattening.

So, if this 10’s – 2’s spread continues to decline, and turns negative (inverts) then that will be a sign that investors need to begin to exit the stock market, because a serious recession is looming, and the Fed won’t have much ammunition to fight it.

If I was stuck on a desert island (with an internet connection and access to my trading accounts of course) and could only have one indicator to watch to tell me when to reduce exposure in the markets, this 10’s – 2’s spread would be it – and it’s not sending positive signals for 2018!
3 Catalysts for the Market, Plus a Wildcard to Watch, September 5, 2017

The Sevens Report is everything you need to know about the markets, in your inbox by 7am in 7 minutes or less. Claim your free two-week trial today.

Ever since I started my career I’ve viewed the post Labor Day time in the market as the “make or break” period of the year—because I’ve found the September-December months provide an inordinate share of both risks and opportunities for portfolios… and I believe this year will be no different.

So, as we start this “stretch run” into the end of the year, the current market set up remains as follows: Stocks have had a great year from a return standpoint, and momentum and the benefit of the doubt remain with the bulls. Yet at the same time, cracks are appearing in this Teflon market, and as such I view the market as being at much more of a tipping point than most analysts.

I believe we will either get the positive catalysts that will send stocks higher between now and year end, or the forces that have powered stocks higher throughout 2017 (earnings growth, momentum) will begin to recede, potentially opening an “air pocket” like we saw in August 2015 and early 2016.

I want to spend time today focusing on the key catalysts that I believe will decide whether the market extends the 2017 gains between now and year end, or whether we see a pullback.

But before I go into these catalysts, with regards to the weekend’s news, it goes without saying that a military conflict with North Korea is a near-term bearish gamechanger.

To be clear, I do not think that it will happen, but at the same time the level of tension here is rising considerably. If there is a military strike against North Korea, reducing tactical positions will be prudent, and it’s one reason why I continue to advocate buying puts on the Nasdaq or Russell with September or October expirations.

Away from North Korea, the catalysts that, in our opinion, will make or break 2017 are: Tax cuts, earnings, and the ECB/Fed decisions.

3 market catalysts to watch

Catalyst 1: Tax Cuts. Why This Matters—It Could Spark Another 5% Rally (Easily). Tax cut disappointment is a risk to the markets, but in reality, the likely market implications for the tax cut issue are either 1) Nothing, or 2) Positive.

I say that for a simple reason… the market is expecting very little in the way of tax cuts (28% corporate rate, foreign profit repatriation). So, it’ll take literally no change to the tax code to really disappoint markets and cause a tax cut related pullback. Conversely, the market has not priced in 25% (or lower) corporate tax rates and aggressive foreign profit repatriation. If that happens, expected 2018 S&P 500 EPS will rise immediately to $145/share (conservatively), which should allow the S&P 500 to rally close to 5% and still not breach 18X 2018 earnings.

Key Dates: There needs to be a formal bill introduced into one of the chambers of Congress by mid-October if we’re going to get something done by early 2018. If there’s no bill by then, look for stocks to be mildly disappointed. If there’s nothing by year end, look for it to be a headwind.

Catalyst 2: Earnings. Why This Matters—It Could Make the Market Too Expensive on a Valuation Basis. The 2017 earnings estimate for the S&P 500 is about $131/share. The 2018 S&P 500 earnings estimate is $140/ share. That’s about 7% yoy earnings growth—so that’s accounted for the vast majority of the S&P 500’s 10% YTD return.

But, there are some early signs that the growth rate of earnings is starting to peak. More specifically, a good Q2 earnings season failed to spark much of a rally in the market, so if Q3 earnings disappoint (even a little bit) that could cause some concern about that $140 2018 S&P 500 EPS, and investors might begin to book profits, which could easily snowball given extended valuations.

Key Dates: Oct. 9. That’s the unofficial start of Q3 earnings season (the big banks report that week).

Catalysts 3: Fed/ECB. Why This Matters—The Dollar. The ECB decision on the announcement of tapering (which will come this Thursday), and the Fed’s commentary at the meeting on Sept. 20, will be important for the markets for one main reason—currencies.

The Dollar Index is near multi-year lows on the expectation of ECB tapering, and that’s been an unsung tailwind on the markets so far in 2017. But, if the ECB surprises this Thursday and doesn’t announce its intention to taper QE starting in 2018, the dollar will surge and the euro will drop, and that could be a surprise headwind on U.S. stocks.

Additionally, since July the market has largely convinced itself that the Fed won’t hike rates in December, but it’s important to realize that Fed leadership (Yellen, Dudley, Fisher) haven’t really confirmed that expectation. If economic data gets better between now and then, even with low inflation, the market could have to price in another rate hike, which could also be a near-term head-wind.

Key Dates: Sept. 7 (ECB Meeting), Sept. 20 (FOMC meeting).

Wildcard to Watch: Withheld for subscribers. Unlock with a free two-week trial subscription to the Sevens Report.