Posts

Commodities Update, August 22, 2017

The Sevens Report is everything you need to know about the markets in your inbox by 7am, in 7 minutes or less. Start your free two-week trial today and see what a difference the Sevens Report can make.

Commodities were mostly higher yesterday as gold continued to benefit from risk-off money flows and a weaker dollar, which also propped up copper futures. Meanwhile, crude oil bucked the trend and gave back most of Friday’s rally. The benchmark commodity index ETF, DBC, fell 1.21% thanks to he declines in energy futures.

Yesterday’s pullback in oil was a textbook retracement of Friday’s very “squeezy” rally. Shorts that were run out of the market late last week repositioned yesterday morning, which influenced the heavy trading that was largely dictated by technicals. WTI futures fell 2.22% on the day.

Friday’s big rally essentially created a “gap” in the market as the bulk of the move occurred in less than an hour, and on very light volume. That set things up for a reversal, and because newswires were very quiet yesterday, algos and technical traders took control of the market and largely “filled the gap” as we ended the day near where Friday’s rally began.

As far as the longer-term trend in oil goes, yesterday’s session was rather insignificant. The market remains in a broad, sideways range with the $50 mark continuing to act as a stubborn resistance level.

Fundamentally, the OPEC/NOPEC meeting in Vienna was anticlimactic. The previous extraordinary meeting was a non-event as well, and the market is beginning to shrug off OPEC-related headlines more and more as the cartel has been largely ineffective in recent months.

The oil market remain bearish for now, as US production continues to grind higher and OPEC has so far failed at trying to offer material support to the market through their policy decisions. Looking ahead, the $50 mark in WTI is a very important technical and psychological resistance level that will not likely be violated in the absence of a legitimate bullish catalyst.

Natural gas rallied 2.42% yesterday as the market continues to show signs of life in the late summer. There was no real catalyst for the move yesterday, but nat gas is continuing to show signs of putting a bottom in and forming support in
the $2.80-$2.90 area.

Looking ahead, the bulls have their sights set on reclaiming the $3.00 mark, and a close above would be a bullish development on the charts. That would match the supply side fundamentals showing a potential long-term shift of supply levels turning lower.

In the metals, the weaker dollar was the primary influence on the market yesterday, as gold rallied 0.39% and copper rallied 1.36%. Gold continued to catch a bid from the cautious feel in the market after last week’s sharp pullback in stocks, but futures failed to close at a new high and above the $1300 mark despite rallying through the important resistance level briefly in Friday trade.

For now, we remain cautious on gold as the technical outlook is rather cloudy. If, however, bond yields break- down further (more on that in the currencies and bonds section) then gold will surely have the support to break out through $1300 and begin a new uptrend.

Copper continued to grind higher yesterday with futures hitting the highest level since late 2014. With the price action in gold and the bond market both flashing a warning sign for risk assets, copper continues to flash a positive signal for the global economy.

Looking ahead, the path of least resistance is still higher for copper, which is a positive for the global economic outlook and risk assets. Yet, the biggest thing to watch with regard to the rally is the dollar, as a reversal back higher in the buck could significantly damage the uptrend in all metals.

Time is money. Spend more time making money and less time researching markets every day. Subscribe to the 7sReport.com.


Oil Outlook: Getting More Bearish, March 15, 2017

Oil Rig - Oil Report was BearishWhy the Monthly OPEC Report Was Bearish Oil
An excerpt from today’s Sevens Report—get a free 2-week trial of the report with no commitments.

Oil remains the big story, as its early morning sell-off to multi-month lows prompted a pullback in stock futures, and ultimately the major US equity indices opened lower. WTI futures finished the day down 1.43%, only slightly above where they opened ahead of the late-November OPEC meeting, where members agreed to collectively cut output.

OPEC released its monthly oil market report yesterday, and the big catalyst in the data was a self-reported increase in February oil production by the de facto leader of the cartel, Saudi Arabia. According to direct communication, Saudi Arabian oil output rose 263.3K b/d to 10.01M b/d. The dip below the psychological 10M mark in early 2017 helped futures stay afloat above $50, as Saudi Arabia was showing their commitment to price support by cutting below their allotted quota (which in fairness they are still below). While data gathered by secondary sources showed another drop of 68.1K b/d to 9.80M b/d in Saudi production, the markets focused on the bearish direct communication data, as it suggests that Saudi Arabia’s commitment to oil cuts may be becoming exhausted.

Another notable takeaway from the release was that OPEC only projects that US oil supply will grow at 340K b/d in 2017. Still, at the current pace (which we will admit does not seem sustainable through the medium term), US producers have already brought 318K b/d online in 2017. Today’s EIA report very well could show an increase through that annual expected rise of 340K b/d.

Bottom line, the rapid increase in US production in recent months has been the biggest long-term headwind for the oil market, as it has offset the efforts of the global production cut agreement while simultaneously causing angst within the ranks of OPEC (namely the Saudis) as they start to see market share slip away.

Without the full commitment of Saudi Arabia to the global production cut agreement, the deal loses a lot of its luster, as they are the key player who has always taken on the bulk of the cuts and taken the near-term hit in market share for the longer-term benefit of the entire cartel. Meanwhile, “compliance cheating” by other members is historically high, and the chances that compliance remains as high as it is right now if Saudi Arabia begins to increase production are essentially zero.

The Sevens Report is in your inbox by 7am each morning. Save time each morning by getting in-depth and jargon-free analysis of stocks, bonds, commodities, currencies, and economic data. Sign up for your free 2-week trial.

How Far Could Stocks Go? Let’s Look at the Charts. March 2, 2017

How Far Could Stocks Go?

Stocks have screamed to all-time highs in recent weeks, and with new highs always comes the question of how far could stocks go? We like to regularly offer fundamental valuation updates as we did two weeks ago, but it is also important to outline what the charts are telling us as far as upside targets and key support levels for near-term price movements.

This stock market technical update is an excerpt from our March 1st Sevens Report. Claim your free 2-week trial today and cut through the jargon to specifics to support your client conversations. 

In the wake of the election there were a lot of very important technical developments. The two most notable were the shift from a bear market signal to a bull market signal in Dow Theory when the S&P was trading at 2165, and confirmation of that signal when the S&P broke to all-time highs November 21.

Currently, both the technical trend and upside momentum of the market continue to suggest the path of least resistance is higher for the medium term. That is the case in spite of the fact that there are countless fundamental uncertainties, most important are related to politics and fiscal policy.

Prices taken at market close on Feb 28.

Prices taken at market close on Feb 28.

In a situation like this, where technicals are largely divergent from fundamentals, many financial professionals and investors look for some direction as to how far stocks could rally from current levels and where a pullback would most likely pause if not reverse. So, we put together a few upside targets as well as downside support levels to watch for the S&P 500.

In a quick review, when any issue (stock, bond, commodity or currency) is trading in never-before-seen territory, there are only two ways to come up with targets in the direction of the new highs—measured moves, and likely areas of interest for options traders. The latter is relatively easy to figure out, as options volumes generally cluster around the big round numbers (in this case 2350 and 2400).


Tracking Measured Moves.

Measured moves, on the other hand, are a little more scientific. The idea behind a measured move is that if the market moved a certain distance against the dominant trend, it will more than likely move at least that far back in favor of the trend once it resumes.

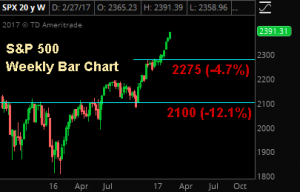
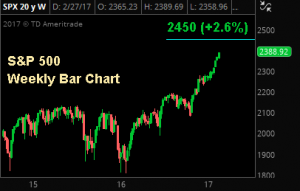
  • Our next upside target is actually a combination of two measured moves and a likely area of interest for S&P option traders: 2450. On the daily chart, a measured move can be calculated from the late-October lows (2084) to the late-December digestion area (2271), which results in a measured move to 2458 in the S&P from current levels. In a supporting fashion, a measured move on the weekly chart can be calculated from the previous S&P highs of 2126 to the February ’16 lows of 1810. That results in a target of 2442.
  • This gives us an ultimate target window of 2442-2458, which encompasses a likely options trader target of 2450.

stock market charts, March 2

  • Bottom line, we are not suggesting that this bull market will end in the mid 2400s; however, for those looking to take profits, you likely will not be alone in doing so in that window around the 2450.

Support Levels

Turning to support levels, the February melt-up in stocks has left a large “volume gap” on the chart, which basically means stocks sprinted from around 2300 to 2360. Because of the velocity of that move higher, there were not many logical support levels created in the month of February. And a set up like that raises the odds that there could be a swift move back through that area.

  • There is an initial and minor area of support around 2343, where there was minor consolidation on February 16. This area will at least be noticed by technical traders and volume-driven algorithms.
    Secondary and more formidable support lies near the previous set of new all-time highs established in December in the band between 2270 and 2280. Here there will be buyer support from both bulls who missed out on the breakout as well as faster-money short sellers looking to book profits.

March 2, book profits

  • Our final support zone is derived from a weekly timeframe, and again at a previous all-time high of 2100, where the most consolidation occurred since the tech sell-off finally ended in 2002.

These levels are meant to provide you with a general idea of the most important technical levels on either side of the broader stock market right now. This information, we have heard in the past from advisor subscribers, is very useful in conversations with clients.

Join hundreds of advisors from huge brokerage firms like Morgan Stanley, Merrill Lynch, Wells Fargo Advisors, Raymond James and more… see if the Sevens Report is right for you with a free 2 week trial.

Oil Market Internals Confirm Our View of “Lower-for-Longer” Price Environment, February 24, 2017

This is an excerpt from today’s Sevens Report. Sign up for your free two-week trial to get everything you need to know in your inbox, by 7am in 7 minutes or less.

We have recently been monitoring the calendar spreads and term structure of WTI crude oil futures with a little more attention, as there have been notable developments.

As a refresher, a calendar spread is simply the difference in price between two contracts with different expirations. For example, contracts with a December ’17 expiration are currently trading at a roughly $1.00/bbl premium to contracts expiring in December ’18 (this is called an inverted market, or backwardation, and is not typical in energy markets). Normally, back-month con-tracts are more expensive than front-month contracts to reflect the price of storage and other variables. Such a structure is called normal contango.

The trend is long-term bearish oil.

The trend is long-term bearish oil.

Over the last week or two, calendar spreads have surged, which would be considered very bullish in normal market conditions like we had late last year when OPEC announced their agreement to cut production with several large NOPEC producers. After that announcement, the entire WTI expiration curve rallied on the speculation of that bullish development in the supply-demand fundamentals with front-month contracts out-performing back months (calendar spreads rallied, con-firming the move in active-month futures).

In the current case, the strength in the calendar spreads has been the result of weakness in back-month contracts like December ’18. Think about the simple equation a – b = c (calendar spread). If “a” (Dec ’17) and “b” (Dec ’18) are both increasing, but the pace of a’s increase is faster, “c” will be positive (so the calendar spreads would be rallying, which is bullish). Right now, “c” is rising because of a faster decline in “b” than in “a” and that is far less of a reason to be optimistic on this current, sluggish trend higher in oil prices.

Stepping back, this development in the calendar spreads confirms what we have been saying, and that is we remain in a lower-for-longer price environment in the energy market.

The logical reason for a faster decline in back-month contracts such as December ’18 expiration suggests that US producers are hedging out future production for wells they have either just brought online or are in the process of bringing online. And this concept supports our idea that US production has not only bottomed, but has begun a cyclical move higher.

Bottom line, that trend is long-term bearish oil for two reasons. First, the obvious fact that rising US output will offset the efforts of the production cut agreement overseas is supply side bearish. Second, OPEC producers are not likely going to be comfortable with the idea of losing market share to the US again (after all, that is the reason they switched to “full-throttle” policy back in summer 2014, which led to the near-80% plunge in oil prices over the subsequent 18 months). The more market share OPEC loses to the US the more likely their compliance to individual quotas will begin to fall, which is very bearish for prices as that is what this current recovery into the $50s is fundamentally based on.

Looking ahead, we could very well see a continued run higher towards our initial target of $57.50, or to our secondary target of $60/bbl, as optimism surrounding OPEC compliance remains elevated. The longer-term outlook is not so bright, and the low $50s will likely remain a “magnetic” level for WTI futures.

The Sevens Report is the daily market cheat sheet our subscribers use to keep up on markets, seize opportunities, avoid risks and get more assets. Sign up for a free 2-week trial today.

A More Hawkish-Than-Anticipated Federal Reserve: February 15, 2017

An excerpt from the Sevens Report. Sign up for a two-week free trial of the full report at www.7sReport.com.

Yesterday I began profiling a couple of non-political risks to explore when making decisions for your clients and talking with prospects. Here’s the second:

Non-Political Risk 2: A More Hawkish-Than-Anticipated Federal Reserve

Profiling this risk seemed only natural, given Yellen’s Humphrey-Hawkins testimony yesterday, and her marginally hawkish comments served as a good reminder that the market is pretty complacent with regards to expected Fed rate hikes in 2017.

Yellen’s comments to the Fed on Tuesday, February 14th, were slightly hawkish.

Starting with Yellen, she was slightly hawkish in her comments mainly because of her upbeat assessment of the economy combined with her reiteration that waiting too long to hike rates would be “unwise,” and that the Fed will consider further increases at “upcoming meetings.” Finally, Yellen repeated that she expects a “few” rate hikes this year (she cited the median dots were three hikes in 2017).

While none of those comments were new, it was a reiteration that the economy is doing relatively well and that the Fed is focused on removing accommodation, and markets reacted slightly hawkishly as the dollar rose while Treasuries declined/yields rose.

From an equity standpoint, the fact that the Fed has not been hawkish so far in 2017 has helped stocks rally, as the 10-year Treasury yield has backed away from the 2.60% level. Above that we believe higher rates will start to become a headwind on stocks. But, there is clearly a risk that rates rise higher than current expectations, and as such we want to profile that risk.

Probability of 3 rate hikes this year (one more than expected)? > 50%. This is my opinion, and it’s higher than the current consensus, but to me it makes sense. If investors think that better growth is going to support the stock market, then why do they expect that acceleration in growth not to invite more interest rate hikes from the Fed? The answer is because the Fed has been ultra dovish for years, but I believe that is changing due to multiple factors.

First, growth is as good as it’s been in years. Second, dis-inflation/deflation is no longer a threat (we think this is an underappreciated change in the macro-economic dynamic). Even in ’13 and ’14, when growth had periods of acceleration, inflation was still trending downward and the Fed was in full QE mode. Now, inflation is trending upwards. Third, the composition of the Fed will change as Trump can nominate three Fed members this year, and it’s a good bet they will be more on the hawkish side. So, while it’s still Yellen’s Fed, the scales should start to tilt toward the hawks later this year.

“Leading Indicators” and, “How do we position if it happens?” sections are restricted to subscribers.

Take advantage of the limited time special offer—if you subscribe to the Sevens Report today, and after the first two weeks you are not completely satisfied, we will refund your first quarterly payment, in full, no questions asked.

Copyright 2017, Kinsale Trading LLC. All Rights Reserved. www.sevensreport.com

Economic Growth Slows: February 14, 2017

An excerpt from today’s Sevens Report.

Non-Political Risk #1: Economic Growth Slows.

Stronger economic data remains an unsung hero of this post-election rally, and while Trump gets the headlines, it’s really the economic data that’s enabling this rally as better economic growth is allowing the market to continue to give Trump and the Republicans the benefit of the doubt.

I can go through the litany of reports, but whether it’s PMIs, the Jobs Report, or Business Investment, the data has been accelerating since mid to late 2016, and that’s created the proverbial “rising tide” that’s helped under-write both policy optimism and the rally in stocks.

But, while hope may be growing that there will be less drama from the administration (the reason for Monday’s rally), at the same time there’s growing evidence that actual policy reality will not meet market expectations.

So, in the near term, it’s going to be up to economic data to continue to provide a reason for markets to give Washington the benefit of the doubt, otherwise the sober reality of a market that now trades well over 18X current-year earnings will begin to cause problems.

Bottom line, if economic growth slows in the near term, that will cause a pullback in stocks. So, in today’s Sevens Report for subscribers, I go into detail on: 1) How likely is an economic slow down? 2) What are the leading indicators to watch? and, 3) How do we position if it happens?

First, how likely is an economic slow down? > 50%.

A probability that high may surprise people, but I have several reasons for it: First, we’ve seen an acceleration in economic activity, but we still haven’t really achieved the “breakout” pace of consistent 3% GDP growth that tends to feed on itself and further stimulate the economy. For all the excitement, we’re still in a 2%ish GDP regime (GDP Now from the Atlanta Fed has Q1 GDP at 2.7% in Q1). Point being, things down have to slow very much before the economy is right back in neutral.

Second, the consumer has powered this economic acceleration, but the consumer is tired. Credit creation is slowing, and retail sales reports have been lackluster of late. To boot, the job market remains basically at full employment and while wages are rising, they aren’t rising fast enough to power incremental acceleration consumer spending. Unless we see proof consumers are accessing the equity in their homes, I don’t see what will cause consumer spending to grind higher.

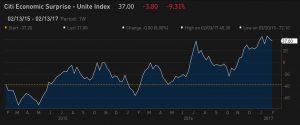
The Citi Economic Surprise Index rose steadily through Q4 of 2016 as economic data consistently beat expectations. Going forward, this index is now an important leading indicator for the market, as any material move back down towards zero will create a headwind on stocks.

Third, business investment has accelerated lately and that is good, but the uncertainty over the tax code changes (and trade in general) has the potential to be-come a headwind on business investment. Here’s my point: The tax changes being discussed in Congress could eliminate interest deductibility and change a host of other tax issues. If I’m a business and I’m thinking of getting a big loan to finance expansion, I’m likely going to wait until there’s more clarity on these and trade issues be-fore taking on too much risk.

Finally, leading indicator of growth for the global economy, China, is actively trying to slow its economy. China’s credit-fueled expansion back in February 2016 marked an inflection point in the global economy and things have been better since. But with a year of stimulus be-hind it, currency issues, and once again overheating property and asset markets, Chinese authorities are trying to cool their economy. The effects aren’t immediate or direct on the US economy, but the fact is that a slow-ing Chinese economy will become a headwind on the US at some point (how much of a headwind depends on how well the cooling is managed).

“Leading Indicators” and, “How do we position if it happens?” sections are restricted to subscribers.

Take advantage of the limited time special offer—if you subscribe to the Sevens Report today, and after the first two weeks you are not completely satisfied, we will refund your first quarterly payment, in full, no questions asked.

Copyright 2017, Kinsale Trading LLC. All Rights Reserved. www.sevensreport.com

Economic Cheat Sheet: February 13, 2017

Last Week:

There was very little incremental economic data last week, and what reports did come met expectations and importantly did nothing to change the perception that economic activity is legitimately accelerating—a perception that continues to support stocks broadly.

From a domestic data viewpoint, there isn’t a lot to talk about. Jobless claims continued to fall and hit another multi-decade low (a 43-year low), and that’s even more impressive when you consider how much the population has grown since then. Internationally, there was mixed data from China as their foreign exchange reserves dropped below the psychologically important $3 trillion level. While that was ignored by markets this week, China continues to bubble as a potential macro surprise in Q1/early Q2. These foreign currency reserves are a story we need to continue to watch.

But, January Trade Balance was much stronger than expected (exports up 7.9% vs. (E) 3.1%), and that data point early Friday helped alleviate some concern. Still, China’s currency reserves are declining, and authorities are actively trying to pull leverage from their economy and cool growth. More often than not, that leads to some sort of macro-economic growth scare—so just a heads up for the coming months.

Bottom line, economic growth remains an important pillar of this rally, and nothing last week changed that set up, which again was why at worst stocks were flat before the political headlines caused the late-week rally.

This Week:

As we’ve said, two of the biggest risks to the rally outside of Washington remain 1) Lackluster data and 2) A more hawkish Fed. Given those risks, the growth and inflation data this week is important.

Janet Yellen (AP Photo/Jacquelyn Martin)

However, the most important event of the week will be Fed Chair Yellen’s semi-annual Humphrey-Hawkins testimony to Congress, on Tuesday (the Senate) and Wednesday (the House). While she isn’t going to telegraph when the Fed will raise rates, her comments are still important considering the market remains complacent with regards to a Fed rate hike. There is no expectation of a March or May hike, and we continue to think the market is a little too complacent with regards to the potential for a May hike (we admit March seems remote).

Staying on the theme of Fed expectations, the next most important number this week is the January CPI report out Tuesday. The Fed does not believe inflation is accelerating meaningfully (due to the data), but if inflation does pick up pace that will be hawkish and will send yields higher—and most likely stocks lower.

Looking at growth data, Wednesday and Thursday are the key days to watch as we get January Retail Sales (Wed), Empire Manufacturing (Wed), January Industrial Production (Wed) and Feb. Philly Fed (Thursday). Of those four reports, the retail sales number is the most important, because consumer spending has been the engine of growth for the US economy, and it needs to maintain a decent pace because while business investment has picked up, it won’t offset a continued moderation in consumer spending.

The Empire and Philly Fed Indices are the next most important numbers next week, as they will give us the first look at February activity. Since better growth is a key support to this rally, they need to show continued strength. Neither number needs to accelerate meaningfully, but we can’t see much of a retracement, either. Bottom line, strong economic data and benign inflation data (Goldilocks numbers) have been an important support for this market as Washington reverts to the mean (gets more dysfunctional), and that needs to continue if stocks can hold recent gains in the face of confusing political headlines.

Get full Sevens Report delivered to your inbox each morning before 7:00am: http://www.7sreport.com/

Chart of the Day: Natural Gas Continues to Climb

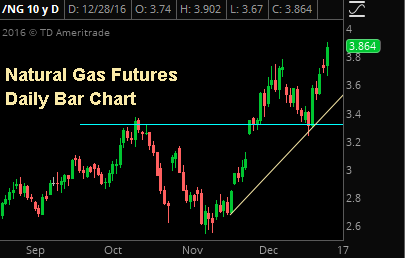
ng-12-28-16

Natural gas futures continued to climb yesterday as weather reports are forecasting colder than average temperatures well into 2017 which is raising prospects for more larger than average supply draws.


Chart of the Day: Nat Gas Surges Ahead of EIA Report

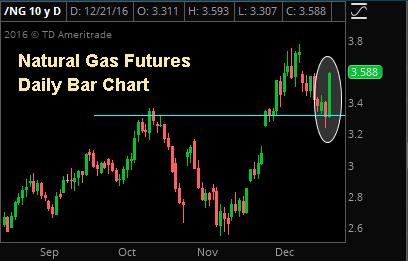
ng-12-21-16

Natural gas surged nearly 10% yesterday thanks to speculation that colder temperatures across the country will boost heating demand and in turn, draw down elevated inventories.


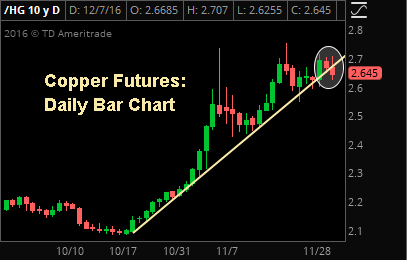
Chart of the Day: Copper Breaks Uptrend Support

hg-12-7-16

Copper futures finally violated the post-election uptrend yesterday suggesting that some profit-taking will likely occur in the coming sessions. $2.50 should be looked to for initial support in the US futures contract.