Economic Cheat Sheet: February 13, 2017

Last Week:

There was very little incremental economic data last week, and what reports did come met expectations and importantly did nothing to change the perception that economic activity is legitimately accelerating—a perception that continues to support stocks broadly.

From a domestic data viewpoint, there isn’t a lot to talk about. Jobless claims continued to fall and hit another multi-decade low (a 43-year low), and that’s even more impressive when you consider how much the population has grown since then. Internationally, there was mixed data from China as their foreign exchange reserves dropped below the psychologically important $3 trillion level. While that was ignored by markets this week, China continues to bubble as a potential macro surprise in Q1/early Q2. These foreign currency reserves are a story we need to continue to watch.

But, January Trade Balance was much stronger than expected (exports up 7.9% vs. (E) 3.1%), and that data point early Friday helped alleviate some concern. Still, China’s currency reserves are declining, and authorities are actively trying to pull leverage from their economy and cool growth. More often than not, that leads to some sort of macro-economic growth scare—so just a heads up for the coming months.

Bottom line, economic growth remains an important pillar of this rally, and nothing last week changed that set up, which again was why at worst stocks were flat before the political headlines caused the late-week rally.

This Week:

As we’ve said, two of the biggest risks to the rally outside of Washington remain 1) Lackluster data and 2) A more hawkish Fed. Given those risks, the growth and inflation data this week is important.

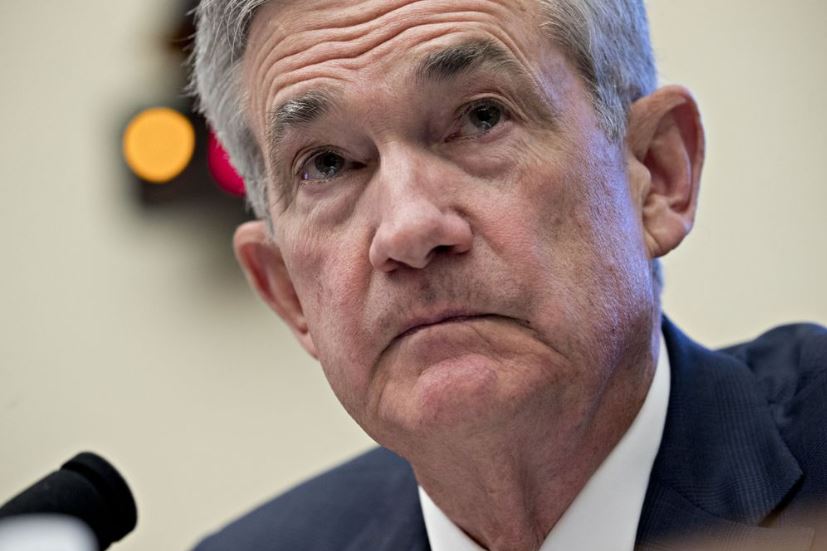
Janet Yellen (AP Photo/Jacquelyn Martin)

However, the most important event of the week will be Fed Chair Yellen’s semi-annual Humphrey-Hawkins testimony to Congress, on Tuesday (the Senate) and Wednesday (the House). While she isn’t going to telegraph when the Fed will raise rates, her comments are still important considering the market remains complacent with regards to a Fed rate hike. There is no expectation of a March or May hike, and we continue to think the market is a little too complacent with regards to the potential for a May hike (we admit March seems remote).

Staying on the theme of Fed expectations, the next most important number this week is the January CPI report out Tuesday. The Fed does not believe inflation is accelerating meaningfully (due to the data), but if inflation does pick up pace that will be hawkish and will send yields higher—and most likely stocks lower.

Looking at growth data, Wednesday and Thursday are the key days to watch as we get January Retail Sales (Wed), Empire Manufacturing (Wed), January Industrial Production (Wed) and Feb. Philly Fed (Thursday). Of those four reports, the retail sales number is the most important, because consumer spending has been the engine of growth for the US economy, and it needs to maintain a decent pace because while business investment has picked up, it won’t offset a continued moderation in consumer spending.

The Empire and Philly Fed Indices are the next most important numbers next week, as they will give us the first look at February activity. Since better growth is a key support to this rally, they need to show continued strength. Neither number needs to accelerate meaningfully, but we can’t see much of a retracement, either. Bottom line, strong economic data and benign inflation data (Goldilocks numbers) have been an important support for this market as Washington reverts to the mean (gets more dysfunctional), and that needs to continue if stocks can hold recent gains in the face of confusing political headlines.

Get full Sevens Report delivered to your inbox each morning before 7:00am: http://www.7sreport.com/

Stocks Reach New Highs

The S&P 500 is now more than 6% above its 200 day simple moving average. And while the trend is clearly still bullish, the complacency in the market paired with the overextended conditions raise the chances of a pullback.


10 Year Note Yield Continues to Fall

The 10 Yr T-Note yield remains below the key 2.50% level and a considerable distance from the long term regression line which suggests a further correction is very plausible.


Bond Bubble

A friend who runs a successful tax lien fund called me this past weekend with an interesting story.

The portfolio manager of one of the biggest institutional investors, a $2-plus billion multi-family office on the West Coast, called him last week and told him to expect a bigger allocation soon because he (the PM of that multi-family office) had reduced the fund’s corporate bond exposure to 0%.

Bond Bubble

The reason: Liquidity fears.

bond bubbleThat PM believes, like I and others do, that the bond market (especially the corporate bond market) is a bubble that has started to pop. And while so far the decline in bonds has been somewhat orderly, this PM believes the risk to corporate bond funds is enough that he wants zero exposure in the fund.

Specifically, he thinks that the enormous amount of capital that has flowed into bond funds and ETFs over the past several years represents a real liquidity risk to the corporate bond market.

The reason is two fold. First, much of that money has flowed into funds and ETFs, which must provide daily liquidity—and a lot of the specific corporate bonds these funds and ETFs own simply don’t have good daily liquidity. Second, due in part to Dodd-Frank, bond dealer desks and inventory have been significantly reduced, meaning there are less available buyers in the event of a stampede towards the exits.

Add on top of that the potential for algorithms to exacerbate moves across asset classes, and we now have the potential for a very small opening for a very large crowd should a selling rush occur.

Now, this PM isn’t unique in his fear. In fact, I’ve spoken to some readers about this very scenario. But what caught me as particularly interesting about this story is that the PM of this multi-family office took the corporate bond exposure to 0%.

Having been on the buy side, I know he must have a lot of conviction to take that exposure to zero. As we all know, corporate bonds have massively outperformed over the past few years, and investors will ask why he’s dumping something that’s worked so well. Bottom line, zero exposure requires a lot of conviction—and a good explanation.

Of course, this is just one story, and while my friend vouches for this PM’s intelligence and experience (he was the PM of this multi-family office through the 2008 crisis), I don’t know him personally.

Still, to reinforce the point, the PM told my friend that he believes his fears were confirmed because when he tried to sell the final $10M worth of corporate bonds in the portfolio, and it took him two days to get reasonable bids on all the individual bonds.

Bottom line, I’ll be the first to admit I’ve been early trying to get ahead of any damage from the bursting of a bond bubble… but that doesn’t mean it won’t happen. I also think that if we see the bond decline accelerate, it

could easily become the biggest potential negative for asset markets that we’ve seen since the financial crisis.

I’m going to continue to look out for this, because if I can help everyone avoid what I think will be one hell of a mess in a declining bond market, I’ll have paid for myself for years!

Economics

  • December Trade Balance was -45.0B vs. (E) -44.3B.
  • December JOLTS (job openings) declined to 5.501M from 5.505M.

Takeaways

Data was mixed yesterday as the Trade Balance was slightly smaller than expected (a nominal positive), while JOLTS (Job Openings and Labor Turnover) were slightly lower than expected (a nominal negative).

But, neither number is influencing anyone’s outlook on the economy, as the December Trade Balance won’t have any effect on Q4 GDP while JOLTS remains generally strong over a longer time horizon, and other employment metrics remain good (most recently the monthly jobs report).


Dollar Break-Out

The dollar index violated the 2017 downtrend yesterday which could mark the beginning of the next upswing for the greenback.


Gold Update

Gold futures violated a longstanding downtrend resistance line yesterday as well as established above the $1235 resistance area; two bullish technical developments.


Key Gold Resistance Level

Gold has rebounded solidly this year but continues to stall at key resistance between $1220 and $1235. Until futures establish above that level, the outlook remains neutral with a downside bias.


Dollar Downtrend

Near term, the dollar index is in a steep down trend that began at the turn of the year. Longer term however, the broader trend in the market remains a bullish one for now.


The Oil Market: Then and Now

The Oil Market: Now and Then

We have included in today’s report a chart that was featured in a Forbes article yesterday regarding the two main influences on the oil market right now: rising US output and OPEC/NOPEC production cuts. At first look, the chart suggests that using hindsight as a gauge, US production lags the rise in rig counts which supports the argument that US production will not rise fast enough to offset the OPEC/NOPEC efforts. But we think that argument is flawed and here is why.

During the last aggressive expansionary phase for US oil production (rising US rig counts/increasing output) which lasted from 2009 to 2014, oil prices were wavering between about $80 and $110/bbl. The correlation between the pace of rig count growth and production growth was rather low as you can see by the difference between the slopes of the two lines in the chart. The likely and simple reason for that low correlation is the fact that there was a lot wild cat drilling, thanks to a surge in industry investment, that turned out to be unsuccessful.

In today’s lower price environment, efficiency is key and exploratory drilling, especially in unconventional areas, is at a minimum while producers focus their time, efforts, and investments on reliable sources of oil with considerably lower lift costs. If this is indeed the case as we believe it is and a good portion of the increasing rig counts that are being reported by BHI are actually DUCs (Drilled but Uncompleted wells) in proven areas, then the relationship between rig counts and production should have a tighter correlation than it did 5-10 years ago.

Bottom line, the fundamental backdrop of the energy market is different right now than it was between 2009 and 2014 and because investment in energy is much lower while the industry remains focused on efficiency, we are more likely to see a tighter correlation between rising rig counts and rising US production which would result in a faster pace of production growth. That in turn would offset the efforts of global producers who are trying to support prices and as a result, leave us in a “lower for longer” oil environment.


Crude Oil Breakout

WTI crude oil futures broke out of a multi-week trading range yesterday and closed just shy of a new 2017 high as a sellers-strike continues ahead of data releases that could confirm (or discredit) proposed global output cuts.