Tom Essaye on “The Bell” Podcast with Nick Colas and Adam Johnson

Nick Colas Bullseye Brief

Thanks to Adam Johnson for having me on his podcast “The Bell” again last week. We talked with Nick Colas, Chief Strategist at Convergex (Wall Street’s Malcolm Gladwell), about VIX, and high volatility. What does it mean when the VIX is so low, what’s being shorted, and what’s happening with the Chinese economy?

Get a free two-week trial of Tom Essaye’s Sevens Report—everything you need to know about the markets in your inbox by 7am, in 7 minutes or less.

Subscribe to The Bell:

Subscribe on iTunes:
http://apple.co/2pxsTIM

Subscribe on Stitcher:
http://bit.ly/2pySjTw

Subscribe on Google Play:
http://bit.ly/2peLMR9

Two Markets Down, Three to Go?, May 18, 2017

The Sevens Report is everything you need to know about the markets in your inbox by 7:00am, in 7 minutes or less. You can start your free two-week trial today and see how much smarter the Sevens Report makes you.

The most important trading across markets Wednesday was not in the stock market, it was in the bond market… and the signals sent there were not good. Both the absolute level of bond yields, and the shape of the yield curve, deteriorated materially… and this is a concern that should not be ignored.

First, the 10-year Treasury yield imploded, falling 11 basis points to close at 2.22%, the lowest in three weeks and now just above the 2017 low of 2.17%.

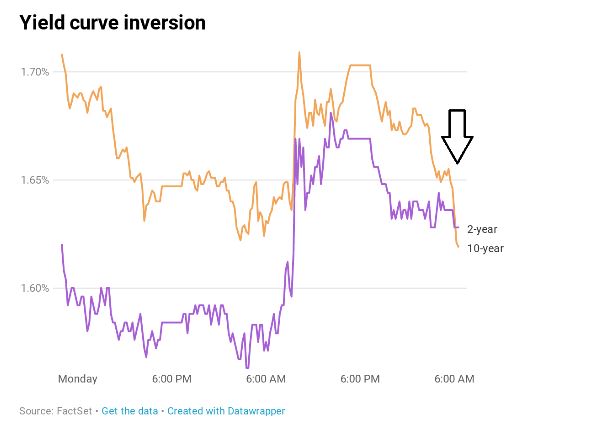
Second, and potentially more importantly, the 10’s—2’s Treasury yield curve also flattened materially, as the spread fell from 1.04% to 0.92%.

sevens report - trumponomics

This is especially important, because the 10’s—2’s yield spread has now retraced the entire post-election steepening, and the curve is more flat than it was pre-Trump presidency. That is a very bad sign for banks, and since banks must lead a market higher in a reflation expansion, that is a bad sign for the entire stock market.

The 10’s—2’s spread has more than retraced the entire post-election move, as has the US Dollar Index (two down).

The 10-year yield is threatening to fall to fresh lows for the year. Yet, the BKX (Bank Index) remains nearly 20% above the pre-election close, and the S&P 500 still trades almost 10% above its pre-election close.

So, are we now looking at a situation where we are two down, three to go?

This situation cannot exist in perpetuity, and the collapse in yields yesterday is a warning sign that should not be ignored.

It’s not definitive yet, and one bad day doesn’t break a trend, but the price action in the bond market is becoming outright worrisome. And, I must continue to stress (as I’ve been doing since mid-March) that the bond market is the leading indicator for stocks. If the 10-year yield breaks below 2.17%, that will add to that warning. At that point, I will consider becoming more defensive in our portfolios.

Again, for context, the entire 2017 stock market rally is based on a expectation of an economic reflationary expansion. But, that expansion likely can’t occur unless the pro-growth policies from Washington actually materialize, and that probability is decreasing daily.

So while stocks have held up, reflationary-sensitive as-sets have negatively reacted (banks, bonds and cyclicals). These sectors must lead a reflationary bull market, yet all of them are breaking down or are in danger of breaking down. If they go, then the broad market isn’t far behind.

Again, I’m not saying get materially defensive yet, as one bad day doesn’t invalidate the market’s resilience. But caution signs are growing on this market, and I do not want anyone blindsided.

The Sevens Report is the daily market cheat sheet our subscribers use to keep up on markets, seize opportunities, avoid risks and get more assets. Start your free two-week trial today.

Trumponomics Update, May 17, 2017

Trump, Trumponomics, politicsJoin hundreds of advisors from huge brokerage firms like Morgan Stanley, Merrill Lynch, Wells Fargo Advisors, Raymond James and more… see if The Sevens Report is right for you.

Politics remains a deafening influence on the markets in 2017, but amidst the ongoing circus (which again got bigger overnight) I wanted to step back and take a look at the current state of the Trumpenomics agenda, revise current markets expectations, and re-examine what will create positive or negative political surprises for stocks over the coming months and quarters.

For specific ETF winners and losers depending on how these events resolve themselves in the coming months, subscribe to the free two-week trial of the Sevens Report.

Finally, I want to provide some independent context to the recent political headlines. First, they are net negative because they are causing some Republicans to start to distance themselves from Trump, and that reduces the chances of tax cuts. Second, if there was some crime committed (obstruction of justice, etc.) that is clearly a bearish gamechanger—but we are not there yet. Third, impeachment claims are currently overblown. It’s a Republican Congress and Congress must decide impeachment. Every Republican, at this point, has a better chance of getting re-elected if they pass tax cuts rather than dump Trump, and we can always count on politicians to focus on their re-employment. Bottom line, these never ending headlines are a headwind on stocks, but they are not a bearish gamechanger, yet.

Trumponomics Pillar 1: Tax Cuts

What Was Expected By Markets: An agreement in principle by the August Congressional recess to cut corporate taxes to the low-20% range, and include a one time, 10% repatriation tax holiday for foreign profits.

Reality: Nothing. There has been little-to-no progress on the tax issue, and major sticking points remain between Republicans, including border adjustments and removing interest deductibility for corporations.

Market Impact: So far, stocks have generally weathered the ineptitude here because there is still the broad expectation that there will be corporate tax reform before the mid-terms in 2018 (people are now pointing to Q1 2018).

Current Expectation: A small corporate tax cut into the high-20% range in place by Q1 2018, and some foreign profit tax repatriation holiday (around 10% tax rate).

Bullish If: Withheld for subscribers. Sign up for your free trial today.

Bearish If: Withheld for subscribers. Sign up for your free trial today.

Trumponomics Pillar 2: Deregulation (Especially Obamacare)

What Was Expected: Repeal and replacement of Obamacare in the first 100 days; massive deregulation via executive order, especially regarding environmental regulations.

Reality: Virtually nothing. While the House passed an Obamacare repeal/replace, there is no credible path for the legislation to make it out of the Senate. Meanwhile, there has been progress on reducing one-off regulations, but it’s not the type of large-scale deregulation that will ignite economic growth.

Market Impact: Healthcare has outperformed on the reduction of political risk (XLV, IHF, IBB). Overall, however, no macro impact.

Current Expectation: Not much. The healthcare bill is in limbo, and there’s no expectation of a Obamacare repeal/replace anytime soon. Meanwhile, Dodd-Frank banking regulations remain largely in place and it’s unlikely we’ll see a large overhaul of that legislation, either (that’s anecdotally negative for regional banks as they bear an outsized compliance burden compared to money center banks).

Bullish If: Withheld for subscribers. Sign up for your free trial today.

Bearish If: Withheld for subscribers. Sign up for your free trial today.

Trumponomics Pillar 3: Infrastructure Spending

What Was Expected: $1 trillion over a 10-year period (this was always an exaggeration, but a lot was potentially expected).

Reality: Virtually nothing. Infrastructure spending has been soundly buried between the healthcare drama, tax cut bickering, and the constant media battles emanating from the White House.

Market Impact: Infrastructure stocks that rallied hard following the election have lagged so far in 2017, but this hasn’t had any macro impact on markets.

Current Expectation: Nothing. Some hope that we will see a bipartisan infrastructure bill by Q2 2018, but it’s so buried by everything else right now that’s not very likely.

Bullish If: Withheld for subscribers. Sign up for your free trial today.

Bearish If: Withheld for subscribers. Sign up for your free trial today.

Bottom Line

Earnings and economics have helped to offset any Trumponomics disappointment as Q1 earnings were strong, and $138 2018 S&P 500 EPS is supporting stocks in the face of repeated Washington failures. Meanwhile, economic data has been “fine” on an absolute basis despite the slight loss of momentum recently.

Point being, markets have been lucky that earnings and economics have provided a shock absorber for the policy disappointment; but considerable risks remain should no further policy progress occur in the coming months and quarters, and given the seemingly unending scandalous headlines emanating from the White House, the probability of nothing happening is rising.

If we do not see real political progress by the end of ’17 or ’18, then its unlikely that economic growth will be able to hold up as the uncertainty surrounding these policies will begin to act as a headwind.

Get the simple talking points you need to strengthen your client relationships. Get your free trial today. 

What Direction is the Pain Trade?, May 16, 2017

The Sevens Report is the daily market cheat sheet our subscribers use to keep up on markets, seize opportunities, avoid risks and get more assets. Sign up today for a free two-week trial. 

Pain Trade Sevens ReportLonger term readers know that one of the better indicators we use to determine the near-term trend of markets is the “pain trade,” and figuring out whether the pain trade is higher or lower can help us determine whether the near-term risk for stocks is for a breakout, or a pullback.

For reference, the pain trade is an industry term that describes the most painful market outcome for investors. It’s based on the simple (and accurate) principle that the market always moves to extract the most amount of pain from the most amount of people.

So, if the most amount of people are long and positioned for higher stock prices, the pain trade is lower. Conversely (as has been the case for most of the 2010s), when investors are underweight equities and are cautious and expecting a correction, the pain trade is actually higher, because investors lament underperformance and are “missing” the rally.

We think that after years of the pain trade being higher, we are approaching a turning point where the pain trade will once again move lower, like it was for most of the 90s and 00s, and we wanted to cover the reasons behind that observation. This matters, because if, in the coming months, the pain trade does turn lower, that will effect how we are positioned.

When determining which direction the pain trade lies, I look at

1) Sentiment and

2) Investor exposure to stocks.

Again, as a general rule, if sentiment is bullish/positive and investor exposure to stocks high, the pain trade is lower, meaning a drop in stocks elicits the most pain from the most people.

Conversely, if sentiment is skeptical/cautious and investors are underinvested in equities, the pain trade is higher, meaning a rally in stocks elicits the most pain from investors as they are “missing” the rally.

Investor Sentiment: No Irrational Exuberance, but the Multi-Year Caution is Eroding. Various measures of investment sentiment are simply not signaling an undue amount of euphoria out there at this time.

Put/Call Ratios are in the middle of the historical range (and well above the 0.45% that represents excessive bullishness). Meanwhile, the AAII Sentiment Survey (American Association of Individual Investors) shows just 32.7% bulls, well below the historical average of 38.5%. Again, that’s not the type of extreme bullishness that would make the pain trade lower.

However, not all sentiment indicators are cautious. The Investors Intelligence Advisor Sentiment Index is above 3.0 (the level that denotes excessive expectations of higher stock prices) and the percentage of bullish advisors is creeping towards the peak of 60% (currently 58.7). So, it would appear that advisors are a bit more bullish than options traders or individual investors. But, it’s still a mixed picture, and doesn’t imply the pain trade is materially higher or lower.

Takeaway: For the past several years, market skepticism has helped power stocks higher; but while the expectations of investors and advisors has turned more positive (and hence reduced the upside pain trade) it is still not bullish enough to make us think the pain trade has turned definitively lower near term, yet.

Investor Exposure to Equities: Getting More Long. Underinvestment in the stock market also has been a powerful tailwind on stocks over the past seven years, as cautious investors have been waiting for another financial crisis (one that’s yet to arrive). So, with each new high, investors and advisors have “chased” stocks higher after throwing in their bearish towels and finally getting back in the market.

That’s one of the reasons super-cap internet and tech stocks have outperformed. Those stocks are called “long rentals,” because they are ultra-liquid and are positively correlated to the market in general and tech specifically. It’s an easy, general way to get a client more long the market in a hurry without taking too much risk.

However, now, that broad market underinvestment situation also has somewhat resolved itself. Since October we’ve seen consistent inflows into US mutual funds and ETFs, including in April (if we ignore the large outflows during the first week of April, as people liquidated accounts to pay taxes, contribute to IRAs, etc.)

Additionally, the amount of money market fund holdings over the previous year.

Takeaway: The extreme levels of underinvestment that prompted investors and advisors chasing markets higher has not been eliminated, but it has been seriously reduced… and that also reduces the upward direction of the pain trade.

Bottom Line

For years, the pain trade has been higher due to cautious/pessimistic investors who were burned by the financial crisis, combined with lots of dry power in the form of equity market underinvestment. However, while the pain trade likely is still marginally higher, it is not the bullish force that it once was. As such, we do not expect to see stocks magically grind higher in the face of unimpressive fundamentals the way we did over the past several years.

From a practical standpoint, this analysis reinforces our cautiously positive opinion on stocks, but also restrains us from chasing stocks without evidence of a reignited reflation trade. Bottom line, the pain trade now is much more two sided than it has been in years, and that puts even more emphasis on getting the political and economic analysis right—because at this point just as much pain will be elicited from investors if we roll over, or if we breakout.

Everything in business is a trade-off between capital and returns. See how much you can increase your returns with The Sevens Report.

Weekly Market Cheat Sheet, May 15, 2017

The Sevens Report is the daily markets cheat sheet our subscribers use to keep up on markets, leading indicators, seize opportunities, avoid risks and get more assets. Get a free two-week trial with no obligation, just tell us where to send it.

Last Week in Review:

Economic data last week was mixed in total, but from a market standpoint the takeaway was that it was neither strong enough to support a push through 2400 in the S&P 500, nor weak enough to generate any real selling. So, the net effect is that the market is left wondering whether the economic acceleration can continue, or whether we are losing momentum.

Retail Sales was the most important report last week, and while on the headline it appeared disappointing, a closer look revealed it was basically in line with expectations.

I say that, because while the headline missed estimates (0.4% vs. 0.6%) the revisions to the March data were positive, from -0.2% to 0.1%. Taken in aggregate, the two-month retail sales performance was slightly better than expected.

Looking at the more important “control” group, which is the best measure of discretionary consumer spending, it also appeared to be a disappointment, up just 0.2% vs. (E) 0.4%. But once again, the revisions were positive (from 0.5% to 0.7%), so if you take the two months together it was in line with estimates.

Bigger picture, consumer spending remains decently healthy, but activity isn’t on pace with Q3/Q4 of last year, when consumer spending powered economic growth. Without an acceleration in consumer spending, it’s hard to see the US economy accelerating materially from here.

The other notable domestic numbers last week were the April CPI and PPI. The former was much-hotter-than-expected, as the core rose 0.7% vs. 0.2% on surging service inflation (financial services costs, especially). However, core CPI was slightly underwhelming, rising just 0.1% in April, and up 1.9% year over year, below the 2.0% estimate.

Bottom line, it’s a given that inflation pressures continue to build, but all the statistical data implies they are building very slowly. And given the Fed watches the statistical data, nothing in the inflation numbers will make the Fed think about hiking more aggressively or delaying the June rate hike.

The other notable data last week came from China, and it was on balance negative. April exports, imports, M2 money supply and PPI all missed estimates, although not by wide margins. Not all the data was bad, as new yuan loans were slightly better than expected. Then, this weekend, Fixed Asset Investment, Retail Sales and Industrial Production all slightly missed expectations.

Bottom line, legitimate doubts are creeping in about the state of the Chinese economy, but it’s simply too early for anyone other than Kyle Bass to declare a problem (he’s been warning about the implosion of China for years, and I’m sure one day he will be right. In the meantime, he has plenty of capital to wait it out). Yet for us, slowing Chinese growth remains a risk, but one that just needs to be monitored for now, which we are doing.

This Week’s Preview:

The calendar is once again relatively quiet this week, although we will get the first look at May data, which will help us decide whether the March/April lull in economic growth is ending.

To that point, the two most important numbers this week are the Empire Manufacturing Survey (today) and the Philly Fed survey (Thursday). Both give us our first look at May economic activity, and while both are just regional surveys, they still matter given the seemingly precarious trend in economic data (is it the pause that refreshes, or are we losing momentum?).

Outside of those two manufacturing surveys, April Industrial Production comes Tuesday, and that will give us another hard-data look at manufacturing activity. Remember, while manufacturing PMIs soared in early 2017, actual hard data hasn’t really moved (hence the gap between soft sentiment indicators and hard data). So, it’ll be an economic positive if Industrial Production can show an acceleration in manufacturing activity.

Outside of those reports, the only other notable numbers are housing related, as we get the first look at April home sales numbers. The Housing Market Index comes today, Housing Starts come tomorrow. Sentiment towards housing is pretty buoyant right now, so it’d be unlikely (and a big surprise) if we saw a housing roll over.

Bottom line, this week will shed some incremental light on the current state of economic growth, and given the markets are starving for a catalyst (positive or negative) usually inconsequential numbers may indeed move stocks.

Get the simple talking points you need to strengthen your client relationships with the Sevens Report. Everything you need to know about the markets delivered to your inbox by 7am each morning, in 7 minutes or less. 

What Comey’s Firing Means for Markets, May 11, 2017

Join hundreds of advisors from huge brokerage firms like Morgan Stanley, Merrill Lynch, Wells Fargo Advisors, Raymond James and more… see if the Sevens Report is right for you with a free 2-week trial.

Regardless of how the rest of the year turns out, I personally will always remember 2017 for the fact that I had to try and figure out the market implications of political events that I never thought I would have to worry about.

What Comey’s Firing Means for Markets.Case in point, Tuesday’s firing of FBI Director James Comey moved markets yesterday, and I wanted to cover what that means going forward (it’s a mild and potentially negative, but not a bearish game changer). Now, to be clear, the market is agnostic to the politics of this drama and as such so am I. Whether you or I think the firing was a coverup or justified, it matters not from a market standpoint, so as I always do with political coverage, I will strictly stick to market implications.

The reason Comey’s firing is a mild negative on markets is because it further undermines President Trump and the Republicans’ ability to pass their pro-growth agenda.

Case in point, just yesterday, we saw part of the fallout from the Comey firing as the Republicans were unable to pass a reversal of an Obama rule against methane gas capture on oil and natural gas wells (Republicans say the environmental regulation increases the cost to drill natural gas and oil wells).

Three Republicans; Graham, Collins and McCain, voted with the Democrats, and the repeal measure failed 49-51. Graham and Collins were always “no” votes on the rule, but McCain was expected to vote “yes”—so much so that Vice President Pence was in the Senate to cast the tie breaker. McCain didn’t say so explicitly, but his “no” vote is widely seen as a protest vote against Trump.

Bottom line, the controversy now surrounding Trump’s move to fire Comey is a political hot stove, and some Republicans are already distancing themselves from the President as they are already thinking about re-election. Point being, the path to passing meaningful tax reform or other pro-growth policies just got more difficult.

Now, the good news is that this isn’t a bearish game changer for markets in part because expectations for tax cuts in 2017 are already pretty low.

Still, there is risk here, because the market does still assume some corporate tax cuts/foreign profit repatriation in 2018. If Trump/Republicans lose enough political capital to put a corporate tax cut in 2018 in doubt, then that will be at least a modest negative on stocks.

More specifically, after June 2018 (at the latest), everything in Washington will stop as focus shifts to the mid-term elections. So, if the market begins to think there will be no corporate tax cuts and no foreign profit repatriation, then that will begin to weigh on stocks later in 2017/early in 2018.

Bottom line, unfortunately politics remains an important influence on markets in 2017. On balance, expectations have been tempered from a policy standpoint, but the “gap” between likely policy reality and policy expectations remains wide… and it got wider this week with the Comey controversy.

Cut through the noise and understand what’s truly driving markets, as this new political and economic reality evolves. 7sReport.com.

Volatility—What Goes Down Must Come Up, But It Can Take a Long Time!, May 10, 2017

Get the simple talking points you need to strengthen your client relationships with the Sevens Report. Sign up today for your no obligation 2-week free trial.

Historically low volatility is becoming a bigger topic in the markets these days, and while earlier in the year low volatility was referenced with more of an observational tone, recently I’ve been hearing the bears touting low volatility as something that simply must revert soon, and as such we should be cautious on markets.

VIX volatility - What goes up must come downI don’t have a crystal ball, so I don’t know when normal volatility will return. However, I do want to spend a few moments pushing back on the idea that low volatility by itself means a correction is coming (obviously volatility will return, but as usual the key question is “when,” and ultra-low volatility doesn’t always mean it’ll return to normal levels soon).

First, you’re not seeing things. Volatility is at multi-decade lows, and that can be seen in multiple ways. First, the VIX hit a 23-year low yesterday, falling to the lowest level since 1993.

Second, so far in 2017 the S&P 500 has moved more than 1% on just three separate days, all of which were in March. By this time of year we’ve normally had 19 days where the S&P 500 has moved more than 1%.

Third, with a close at 9.98 yesterday, the VIX now is lower than nearly 99.5% of all the closes since Jan. 1, 1990. Put another way, it’s only closed this low about 0.05% of the time during the last 27-plus years. So, the VIX is extraordinarily low.

But, that doesn’t mean it’s going to bounce back soon.

First, According to a note from ConvergeEx, the all-time low for the VIX 50-day moving average is 10.8, which it hit in Feb. 2007. Right now, the 50-day moving average for the VIX is 12.17.

Takeaway: It’s very unlikely that the VIX will stay at these ultra-low levels for very long, but that doesn’t mean a big rally is looming. It would take several more weeks of VIX at these levels to drag the 50-day MA down towards the all-time lows.

Second, looking at the VIX to measure volatility can cre-ate a bit of an odd picture, because again the VIX is based on options prices and not the actual price move-ments of the S&P 500. Looking at actual stock price movement, it confirms what our eyes tell us.

Going back to the 1950s, the current volatility of stock prices is 48% of its longer-term average. That’s really low. And, this period of historically low volatility has been going on for 78 days (including yesterday). But, that doesn’t mean it necessarily will bounce back.

First, there have been two specific periods of similarly low volatility in the last 20 years. First in mid-2014 (75 days) and second from Nov. ’06 to March ’07 (79 days).

Second, we’re not even close to the record for low volatility. In 1992/1993 and 1995/1996 we saw respective periods of ultra-low volatility last for 179 and 254 days, respectively. That’s double and triple what we’ve seen so far in 2017.

The Sevens Report helps you cut through the noise and understand what’s truly driving markets, as this new political and economic reality evolves.

Earnings Season Post Mortem & Valuation Update, May 9, 2017

The Sevens Report is everything you need to know about the market in your inbox by 7am, in 7 minutes or less. Claim your free 2-week trial.

The S&P 500 has been largely “stuck” in the 2300-2400 trading range for nearly 10 weeks, despite a big non-confirmation from 10-year yields, modestly slowing economic data and political disappointment. Given that less-than-ideal context, the market has been downright resilient as the S&P 500 only fell to around 2320ish. The main reason for that resilience is earnings and valuation.

While it’s true that stocks are at a valuation “ceiling” right now, and need a new macro catalyst to materially breakout, it’s also true that given the current macro environment the downside risk on a valuation basis for the market is somewhat limited. That’s why we’re seeing such aggressive buying on dips.

Here’s the reason I say that. The Q1 earnings season was better than expected, and it’s resulted in 2018 S&P 500 EPS bumping up $1 from $135-$137 to $136-$138. At the higher end of that range, the S&P 500 is trading at 17.4X next year’s earnings. That’s high historically to be sure, but it’s not crazy given Treasury yield levels and expected macro-economic fundamentals.

However, if the S&P 500 were to drop to 2300 on a macro surprise, then the market would be trading at 16.67X 2018 earnings. In this environment (low yields, stable macro environment), that could easily be considered fairly valued.

Additionally, most analysts pencil in any help from Washington (including even a small corporate tax cut and/or a foreign profit repatriation holiday) adding a minimum of $5 to 2018 S&P 500 EPS. So, if they pass the bare minimum of expectations, it’s likely worth about $5 in earnings, and that puts 2018 earnings at $143.

At 2400, and with $143 expected earnings, the S&P 500 is trading at 16.8X 2018 earnings. Again, that is high historically, but for this market anything sub 17X will elicit buying in equities (whether it should is an open question, but that is the reality).

Join hundreds of advisors from huge brokerage firms like Morgan Stanley, Merrill Lynch, Wells Fargo Advisors, Raymond James and more… see if The Sevens Report can help you make more money in less time.

Weekly Market Cheat Sheet: May 8, 2017

The Sevens Report is the daily markets cheat sheet our subscribers use to keep up on markets, leading indicators, seize opportunities, avoid risks and get more assets. Get a free two-week trial—no obligation, just tell us where to send it.

Weekly Market Cheat Sheet

Last Week in Review:

Economic data last week, highlighted by the strong jobs report, helped to somewhat narrow the gap between soft sentiment surveys and hard economic data… although it’s fair to say that gap remains open and is still a headwind on stocks, just a slightly less strong one. It was not all positive last week, though, as we got several signs of potential loss of momentum in China, which was an underreported but potentially important development last week. Finally, the Fed meeting proved to be a non-event, except in that it reaffirmed a June rate hike is likely (but that’s already mostly expected from the markets).

Starting with the jobs report, it met our “just right” scenario. The overall job adds were strong at 211k vs. (E) 185k, but revisions to the March report were negative 19k, so the net number was more in line. The unemployment rate dropped to 4.4%, but that was in part due to a decline in the participation rate. Meanwhile, year-over-year wage increases declined to 2.5% from 2.7%. Bottom line, this number was “fine,” but it wasn’t massively reflationary (in part due to the wage number) and that’s why we didn’t see the strong headline jobs report ignite an immediate reflation rally in stocks (again, the wage number undermined the strong job adds).

Looking at other economic data last week, there were more positives than negatives, highlighted by the ISM Non-Manufacturing PMI, which hit 57.5 vs. (E) 55.8. That strong Non-Manufacturing PMI helped to offset the soft April Manufacturing PMI, which dipped to 54.8 vs. (E) 56.5 while the New Order component dropped below 60 for the first time in five months. While disappointing vs. expectations, it’s important to remember that the absolute level activity remains strong.

Turning to the Fed, the key takeaway from last week’s Fed meeting was that the Fed viewed the loss of economic momentum in Q1 as “transitory,” and still said risks to growth were “roughly balanced.” Both terms are Fed speak for, “We’re going to hike in June despite the soft Q1 GDP.” The market largely expects that (Fed Fund futures have a hike priced at 83% (which is close to a universal conclusion).

Finally, I want to take a moment and focus on Chinese economic data from last week, as the numbers were universally disappointing. Official April Manufacturing PMI dropped to 51.2 vs. (E) 51.7 while composite PMI declined to 51.2 vs. previous 52.1. Additionally, iron ore went into quasi freefall this week, as iron ore futures ended limit down on the Dalian Commodities Exchange on Wednesday night. The drop came after the Chinese steel industry PMI dropped below 50, signaling contraction. Oversupply has something to do with the price drop as well (exports are surging out of Australia) but the bottom line is that base metal prices are a coincident indicator of economic activity. The declines in iron ore, steel and copper last week, combined with the under-whelming Chinese data, definitely caught our attention. We now are officially watching this closely for everyone, and will keep you updated.

This Week’s Cheat Sheet:

This week, April CPI and April Retail Sales (both Friday) are the important reports to watch. The latter is more important for markets at this point than the former, as we need to see a rebound from Q1’s paltry consumer spending. If retail sales fail to show progress and beat expectations, it’ll widen the gap between soft data and hard economic numbers. With CPI, we should see some mild cooling of the recent uptick in inflation, but overall inflation pressures continue to slowly build.

Outside of those two numbers, focus will be on the Chinese CPI and PPI, as again data there suddenly turned lower last week. Bottom line, it should be a quiet week, but retail sales and CPI are important as the “gap” between soft sentiment surveys and hard economic data remains… and it needs to close further if we are going to see a breakout in stocks.

Get the simple talking points you need to strengthen your client relationships with the Sevens Report. Everything you need to know about the markets delivered to your inbox by 7am each morning, in 7 minutes or less. 

Jobs Report Preview, May 5, 2017

For the first time in 2017, the risks to tomorrow’s jobs report are balanced, as a “Too Hot” number will increase the possibility of more than three rate hikes in 2017 while a “Too Cold” number will fan worries about the pace of economic growth, and the ability for better economic growth to push stocks materially higher.

Here’s The Sevens Report traditional “Goldilocks” breakdown:

“Too Hot” Scenario (Potential for More than Three Rate Hikes in 2017)

  • >250k Job Adds, < 4.6% Unemployment, > 2.9% YOY wage increase. A number this hot would likely reignite the debate over whether the Fed will hike more than three times this year.
  • Likely Market Reaction: Withheld for subscribers. Unlock with a free trial at 7sReport.com.

“Just Right” Scenario (A June Rate Hike Becomes More Expected, But the Total Number of Expected Hikes Stays at Three)

  • 125k–250k Job Adds, > 4.7% Unemployment Rate, 2.5%-2.8% YOY wage increase. This is the best-case scenario for stocks, as it would imply still-stable job growth, but not materially increase the chances for more than three rate hikes in 2017.
  • Likely Market Reaction: Withheld for subscribers. Unlock with a free trial at 7sReport.com.

“Too Cold” Scenario (A June Rate Hike Becomes in Doubt)

  • < 125k Job Adds. Given the recent unimpressive economic reports, a soft jobs number could cause a decent sell-off in equities. As the Washington policy outlook continues to dim, economic data needs to do more heavy lifting to support stocks. So, given the market’s focus on future growth, the bottom line is bad economic data still isn’t good for stocks.
  • Likely Market Reaction: Withheld for subscribers. Unlock with a free trial at 7sReport.com.

Help your clients outperform markets by signing up for your free 2-week trial of The Sevens Report.