Get the simple talking points you need to strengthen your client relationships with the Sevens Report. Sign up today for your no obligation 2-week free trial.
Historically low volatility is becoming a bigger topic in the markets these days, and while earlier in the year low volatility was referenced with more of an observational tone, recently I’ve been hearing the bears touting low volatility as something that simply must revert soon, and as such we should be cautious on markets.
 I don’t have a crystal ball, so I don’t know when normal volatility will return. However, I do want to spend a few moments pushing back on the idea that low volatility by itself means a correction is coming (obviously volatility will return, but as usual the key question is “when,” and ultra-low volatility doesn’t always mean it’ll return to normal levels soon).
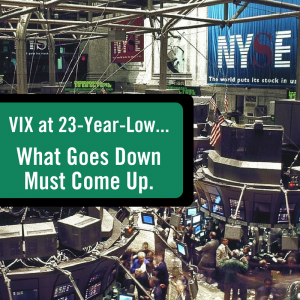
First, you’re not seeing things. Volatility is at multi-decade lows, and that can be seen in multiple ways. First, the VIX hit a 23-year low yesterday, falling to the lowest level since 1993.
Second, so far in 2017 the S&P 500 has moved more than 1% on just three separate days, all of which were in March. By this time of year we’ve normally had 19 days where the S&P 500 has moved more than 1%.
Third, with a close at 9.98 yesterday, the VIX now is lower than nearly 99.5% of all the closes since Jan. 1, 1990. Put another way, it’s only closed this low about 0.05% of the time during the last 27-plus years. So, the VIX is extraordinarily low.
But, that doesn’t mean it’s going to bounce back soon.
First, According to a note from ConvergeEx, the all-time low for the VIX 50-day moving average is 10.8, which it hit in Feb. 2007. Right now, the 50-day moving average for the VIX is 12.17.
Takeaway: It’s very unlikely that the VIX will stay at these ultra-low levels for very long, but that doesn’t mean a big rally is looming. It would take several more weeks of VIX at these levels to drag the 50-day MA down towards the all-time lows.
Second, looking at the VIX to measure volatility can cre-ate a bit of an odd picture, because again the VIX is based on options prices and not the actual price move-ments of the S&P 500. Looking at actual stock price movement, it confirms what our eyes tell us.
Going back to the 1950s, the current volatility of stock prices is 48% of its longer-term average. That’s really low. And, this period of historically low volatility has been going on for 78 days (including yesterday). But, that doesn’t mean it necessarily will bounce back.
First, there have been two specific periods of similarly low volatility in the last 20 years. First in mid-2014 (75 days) and second from Nov. ’06 to March ’07 (79 days).
Second, we’re not even close to the record for low volatility. In 1992/1993 and 1995/1996 we saw respective periods of ultra-low volatility last for 179 and 254 days, respectively. That’s double and triple what we’ve seen so far in 2017.
The Sevens Report helps you cut through the noise and understand what’s truly driving markets, as this new political and economic reality evolves.