Posts

Weekly Market Cheat Sheet, September 11, 2017
Last Week in Review

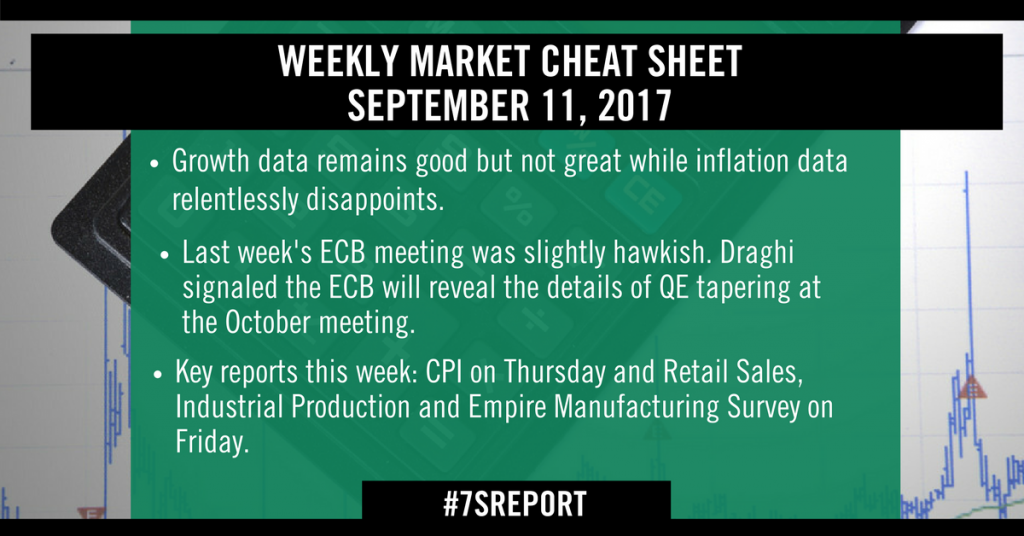
The economic data remains remarkably consistent: Growth data remains good but not great while inflation data relentlessly disappoints. From a market standpoint, that means that the economy isn’t at imminent risk of a material loss of momentum, but at the same time there are no signs of the type of acceleration that would lead to a rising tide carrying stocks higher.

From a Fed standpoint, inflation remains lackluster, and that’s causing a reduction in expectations for a December rate hike. That’s not a medium/longer-term good thing for stocks, because it further throws into doubt the chances for reflation—and economic reflation remains the key to sustainably higher stock prices.

Looking at last week’s data, there weren’t many numbers, but the numbers we got reinforced the “slow growth/low-inflation” trend.

The ISM Non-Manufacturing PMI (or service sector PMI) rose to 55.3 from 53.9. So, there was acceleration in activity in August. But that acceleration missed estimates of 55.8, and while a number in the mid-50s is solid, it’s not the type of number that implies we’re seeing real acceleration.

The other notable number last week that was largely ignored by the media was August productivity and unit labor costs. An uptick in productivity, if it’s consistent and material, could lead to an economic acceleration.

The reason for that is simple: The economy is basically at full employment. But, if those workers get more productive, the total economic output increases, and we get a stronger economy.

August productivity rose to 1.5% vs. (E) 1.3%, so that is a good sign. It’s not nearly the acceleration we need, but it’s a step in the right direction.

However, that productivity number wasn’t the important one from this release. The important number was unit labor costs. Rising unit labor costs is a precursor to larger inflation, so it’s an important number. And, unfortunately, it once again missed expectations. Unit labor costs rose 0.2% vs. (E) 0.3%, providing even more fodder for the “doves” on the Fed to not hike rates in December.

Finally, turning to the ECB meeting last week, you know by now it was slightly hawkish. Draghi signaled the ECB will reveal the details of QE tapering at the October meeting, and he again chose not to try and “talk down” the euro, which led to the euro hitting new multi-year highs (and the dollar hitting multi-year lows).

From a market standpoint, that dollar weakness is a slight tailwind on US stocks, although not a material one. Until we get better inflation or growth data here in the US, the trend of euro strength/dollar weakness will continue.

This Week’s Preview

All the important economic reports this week come out Thursday and Friday, which is nice because that gives us a bit of time to get ourselves squared away following all the hurricane issues from last week.

The most important number this week is CPI, out Thursday. As you know, inflation remains the key issue with the economy and Fed expectations. Frankly, we need CPI to start firming because it’ll give us hope of a looming economic reflation. If, however, this number disappoints, as it has for a few months, we’ll see new lows in the dollar and new lows in Treasury yields, neither of which are a good thing for stocks beyond the very short term.

After CPI, there are three important growth numbers out this Friday: Retail Sales, Industrial Production and Empire Manufacturing Survey.

Starting with the first two, remember there remains a large gap between “hard” economic data and surveys. Put plainly, actual economic data is not rising to the level that’s being implied by the PMIs and/or consumer confidence. The longer that occurs, the more likely it is that the surveys are exaggerating economic growth.

So, the sooner hard economic data begins to accelerate, the better. If retail sales and industrial production can beat estimates, that will be an economic positive.

Turning to Empire Manufacturing, that’s the first data point from September, and that’s always anecdotally important because we don’t want to see any steep drop off that might imply a loss of momentum.

Bottom line, this week gives us more color into the state of growth and inflation in August. We need to see both begin to accelerate if we are to hold out hope that we can see an economic reflation create a “rising tide” for stocks in Q4 ’17 or Q1 ’18.

Time is money. Spend more time making money and less time researching markets every day. Subscribe to the 7sReport.com.
“Is the Stock Market Too Expensive?” February 23, 2017

“Is the Stock Market Too Expensive?” 

That’s a question I’m getting asked a lot lately by subscribers and colleagues.

With stocks at record highs, there is a lot of worry that the market is unsustainably expensive. But, that’s simply not the case.

Yesterday, in the full edition of The Sevens Report, we broke it down.

  • Provided a three-part analysis of what makes the market 1) Expensive, 2) Fairly Valued (with some room for upside) and 3) Cheap
  • Named each catalyst that would decide that valuation level
  • Listed specific sector and style ETFs that we believe can outperform in this valuation environment.

Excerpt from that research below:

Valuation Update: How Overvalued Are Stocks?

It’s no secret that stocks are richly valued, but while those high valuations make me generally uncomfortable (I’m a value investor at heart) I do feel the need to push back a bit on the idea that valuations, alone, are a reason to lighten up on equity exposure.

Yes, in some scenarios the stock market is simply “too expensive.” Still, there are other, more plausible scenarios where I can show the market as reasonably valued or even cheap. Here are a few of those scenarios.

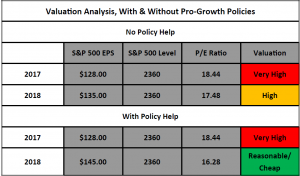
The Market is Too Expensive If: You’re Looking at Current Year Earnings. Looking at current year earnings, the S&P 500 is historically very expensive. With consensus $128 2017 S&P 500 EPS, the S&P 500 is trading at a whopping 18.44X current year earnings. Anything above 18X has proven (longer term) historically unsustainable.

The Market Is Not Too Expensive (Yet) If: You Look At Next Year’s (2018) Earnings (And This is Without Any Tax Cuts). Consensus 2018 (so next year) EPS are around $135, which does not include any benefit from a corporate tax cut. At $135, the S&P 500 is trading at 17.4X next year’s earnings. Yes, that is expensive (the 20-year average is 17.2X per FactSet) but it’s not unsustainable, not in an environment with historically low interest rates and an apparent macro-economic acceleration.

In fact, if the macro set up doesn’t change (and we don’t get any definitively bad news from Washington), I could see investors pushing that multiple to 18X, or 2,430 in the S&P 500 (about 3% higher from here).

Above that, I think the market would get somewhat prohibitively expensive, but that would depend on what’s happening with the economy, inflation and rates.

The Market Is Cheap If: Real, Material Corporate Tax Cuts Get Implemented. If we do get material corporate tax cuts in 2017, most analysts think that would add at least $10/share to S&P 500 EPS, bringing the 2018 number from $135 to $145.

At $145 EPS, the S&P 500 would be trading at just 16.3X next year’s earnings, which in this environment could easily be considered reasonable if not outright cheap.

“Is the stock market too expensive?”

Six Value ETFs That Can (and Have) Outperformed

From a practical standpoint, the fact that the stock market is on the expensive side historically does reinforce my preference for value-oriented ETFs. Since late 2016, we’ve focused our tactical strategies on sectors we considered a “value” and they have handily outperformed the S&P 500:

  • In September of 2016, we strongly advocated getting long banks due to 1) Compelling valuation and 2) The start of the uptrend in bond yields. Since that call on September 26, our preferred bank ETF has risen 41%!
  • In late 2016, while many analysts were chasing cyclical sectors in the wake of the election, we instead advocated buying value in super-cap internet stocks. Our preferred internet ETF has risen 9.8% in 2017, handily outperforming the S&P 500.
  • At the start of 2017, we cited the maligned healthcare sector as our preferred contrarian play for 2017, based on the idea that overly negative political fears had created a value opportunity. Our two preferred healthcare ETFs have risen 7.3% and 7.5% so far in 2017, and we think that trend of outperformance will continue. 
  • More broadly, we have identified two “Value” style ETFs that we believe will outperform the markets in this current macro-environment, and these two broad ETFs remain our preferred vehicle to be generically “long” the market.

The Sevens Report doesn’t just help you cut through the noise and focus on what’s truly driving markets – we also provide tactical idea generation and technical analysis to help our subscribers outperform. You can sign up for your free trial today: www.7sReport.com.

“This is a huge value add. If I can avoid even a modest portion of significant market pullbacks, and be well-invested during bull markets based on your Dow Theory calls, my clients will be extremely happy with me. I already look like a genius to them!” – Financial Advisor with a National Brokerage Firm, New York, NY. 

Central Bank Decisions

Central Bank Decisions

Bank of Japan

The bar was set pretty high for the BOJ coming into yesterday’s meeting.  Investors were expecting a lot of additional monetary easing, but seeing as the yen had already declined significantly, most assumed that the “dovish” results of the meeting were priced in.  They were wrong.

New Bank of Japan Governor Kuroda promised earlier in the week to do everything he can to break deflation, and he stuck to his words.  Without getting into the weeds of the fiscal details, the Bank of Japan has put its monetary accommodation into overdrive.

  • The Bank of Japan is going to specifically try to inflate asset prices (stocks and bonds) by increasing the adjusted monetary base (i.e. printing money) at a pace of 60 to 70 trillion yen annually over the next two years, compared to an increase of 13.4 trillion yen in ’12 and 15.6 trillion yen in ’11.
  • Additionally, the BOJ will start buying massive amounts of long-term government bonds (more than doubling the current pace of 20 trillion worth of bonds to 50 trillion).
  • Finally, the BOJ will increase the amount of ETFs it is currently buying by 100% (from 500 billion yen to 1 trillion yen).

Takeaway

I’m as big a Japan bull as anyone I know – starting from when I first pointed out the bullish trend emerging last fall with the election of Prime Minister Shinzo Abe.  In an investment landscape that is very conflicted and uncertain, the Japan bull market in equities was and is one of the most clear and powerful trends in the market.  But, as much of a bull as I was, I never would have dreamed of this type of historically aggressive monetary policy.  The bottom line here is that I believe that Japanese stocks are heading much, much higher, and the yen is heading much, much lower.  I’ve made the analogy often that buying Japan now is like buying the S&P 500 at the start of the QE program – well now it’s like buying it at the start of a QE program on steroids.  Long DXJ remains my top idea in the markets today.