Posts

Momentum Indicator Update, July 11, 2017

Get the simple talking points you need to strengthen your client relationships with a free trial of The Sevens Report

About two months ago, as markets were grinding relentlessly higher despite underwhelming economic fundamentals, I identified four momentum indicators that would tell us when this market was losing momentum and when the chances for a pullback were rising.

Those four indicators were: 1) Consumer sentiment, 2) NYSE Advance/Decline line, 3) Semiconductors (SOXX) and 4) Super-cap internet (FDN).

Over the subsequent eight weeks, three of those four indicators have remained broadly positive. Only semiconductors have lost momentum (SOXX hit multi-month lows in Thursday’s selling). But while the three remaining momentum indicators are still giving positive signals, recently there have been some signs of fatigue.

First, FDN (First Trust DJ Internet Index Fund) held the June lows, but it’s stuck in a range currently and can’t seem to break to a higher high.

Second, the NYSE Advance/Decline line is sitting on an uptrend in place since late-February 2016, and if we get any sort of a nasty sell-off in the next few days (like we saw last Thursday) that trendline could break.

Finally, looking at consumer sentiment, unending skepticism towards this now eight-year-long rally remains its most consistent fuel; however, that may finally be changing.

Retail investor sentiment indicators remain overly cautious. The American Association of Individual Investors Bulls/Bears Sentiment is cautious, as there is just 29.6% bulls vs. a historical 38.5%. But, in a notable change, the number of bears also is below average (29.9% vs. the average of 30.5%).

The difference is made up in the “Neutral” category, which has surged to 40.6% vs. an average of 30.5%. Now, that’s not overtly bullish, but it anecdotally reflects the idea that you simply “must” be invested as they market grinds higher. And, that idea is in line with a recent similar reading from institutional investors.

Yesterday, I read a survey from Citi that showed institutional investors are holding their lowest levels of cash since before the financial crisis! According to survey respondents, in June the median cash holdings for institutional investors was just 2.5%, down sharply from the 7.5% level at the end of September 2016. That’s the lowest level of cash on hand since before the financial crisis.
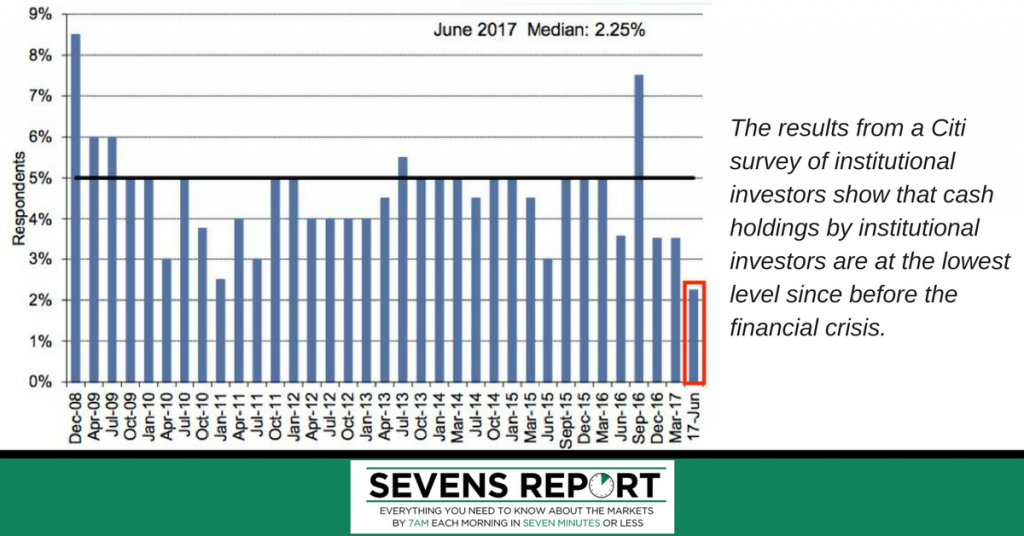
The results from a Citi survey of institutional investors show that cash holdings by institutional investors are at the lowest level since before the financial crisis..png

Now, one statistic doesn’t mean an impending market pullback, but this survey data does generally correspond to the idea that the TINA trade (There is No Alternative to stocks) has finally, and begrudgingly, pulled the remainder of cash off the sidelines and into the market.

And, as history has taught us, we can all guess what happens next.

Regardless, the major point I’m trying to make here is this: We’re nearing a pretty substantial tipping point in markets, and while both the bulls and bears have points of evidence on their side, the benefit of the doubt remains, for now, with the bulls. Still, we need a continuation of the recent better economic data and better inflation numbers to power this market higher, otherwise the chances of some sort of a pullback will indeed rise.

Join hundreds of advisors from huge brokerage firms like Morgan Stanley, Merrill Lynch, Wells Fargo Advisors, Raymond James and more… see if The Sevens Report is right for you with a free two-week trial.
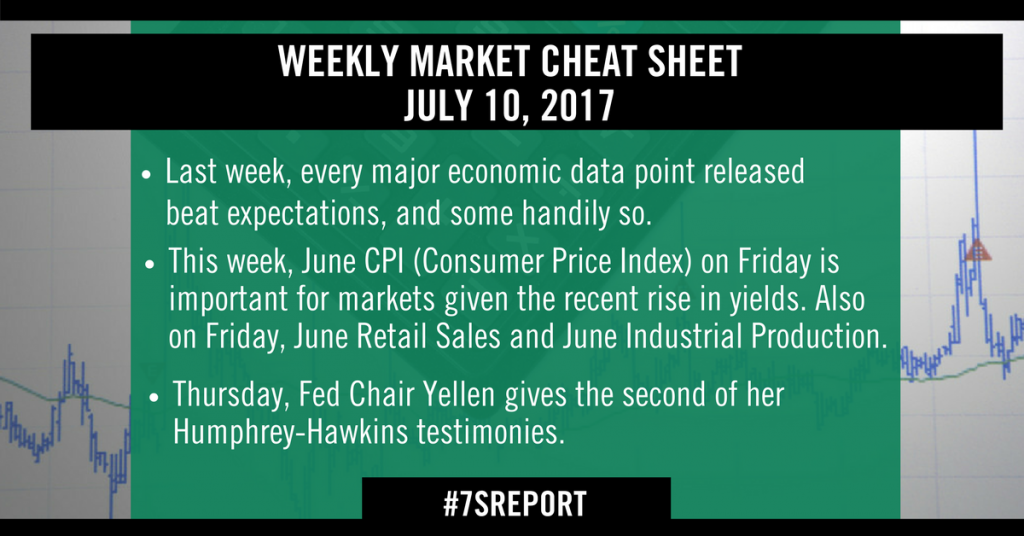
Weekly Market Cheat Sheet, July 10, 2017

The Sevens Report is the daily market cheat sheet our subscribers use to keep up on markets, leading indicators, seize opportunities, avoid risks and get more assets. Get a free two-week trial with no obligation, just tell us where to send it.

Weekly Market Cheat Sheet

Last Week in Review:

Reflation on? Not just yet, but last week’s data did imply that the US economy may be starting to gain more positive momentum, which will be much to the Fed’s relief after looking past recent soft economic data. Specifically, every major economic data point released last week beat expectations, and some handily so.

Before getting to those numbers, it’s important to address the biggest market-moving event last week: The ECB meeting minutes. Anticipation of those minutes, which were mildly hawkish, caused the German bund yield to break to a multi-year high above 0.5%, and that caused an acceleration in the decline in bonds/rise in yields that ultimately resulted in the 1% decline in stocks last Thursday.

The importance of the ECB minutes (and largely all the data from last week) was that it confirmed central banks do expect better growth and inflation, and that expectation is leading them to get less dovish, which is sending global bond yields higher.

The bottom line for the ECB and the Fed remains 1) The ECB is expected to begin to taper QE in January 2018, and end it completely in mid-2018, while the Fed is expected to begin to reduce the balance sheet in September, and hike rates again in December. The events of this week reinforced those expectations, which are largely priced into stocks and bonds at this point.

Turning to the economic data, it was good last week. The jobs report was the highlight, and it was strong. Job adds in June were 222k, solidly above the 170k estimate. However, wages were a slight disappointment, up just 0.2% and 2.5% yoy, which stopped the strong jobs report from being “Too Hot.”

Looking at the other two key numbers last week, the June ISM Manufacturing PMI and ISM Non-Manufacturing PMI, they also were strong. The Manufacturing PMI surged to the best level since August 2014, rising to 57.8 vs. (E) 55.1 while the Non-Manufacturing (or service sector) PMI rose to 57.4 vs. (E) 56.5. Details of both reports were also strong, as New Orders rose, suggesting continued momentum into the summer.

To a point, the data can be taken with a grain of salt, because there’s no question the jobs market remained strong in June (the weekly claims told us that) while the PMIs are still just “soft data” in so much as it’s survey data, and not hard economic data. Still, these numbers were good, and it does reinforce that we are seeing an emerging reflation in the economy, and an emerging reflation trade in markets.

This Week’s Preview:

Normally after the jobs report the following week is pretty quiet on the economic front. Yet that’s not so this week, as we get three very important economic numbers Friday.

June CPI is the highlight of the week, and it will be an important number for markets given the recent rise in yields. Since the Fed and other global central banks expressed surprising confidence in their respective economies in June, economic data has largely reinforced that expectation.

However, now it’s inflation’s turn. If inflation metrics show a further loss of momentum, that will undercut central bank’s expectation of future inflation, and could cause at least a mild reversal in the recent reflation trade (so bond yields down, banks/small caps/cyclicals down, defensives/tech up). Conversely, if CPI is strong, it will further prove central banks were right to look past the soft data, and the reflation trade will likely accelerate. So, this will be an important number regarding sector trade, and near-term performance in the broad market.

Also on Friday we get June Retail Sales and June Industrial Production. As previously mentioned, there is still a gap between soft, survey-based data (the PMIs) and hard, actual economic numbers. Given the strength in the PMIs, expectations for better actual economic data via Retail Sales and Industrial Production now is somewhat expected.

Finally, Fed Chair Yellen gives the second of her Humphrey-Hawkins testimonies this week, and she will address the Senate Banking Committee on Wednesday and the House Financial Services Committee Thursday. The tone of her comments will obviously be closely watched, but with several years on the job, Yellen seems to have learned not to give anything away in these testimonies. Yet if her tone echoes the confidence in the economy and inflation that we saw in the June FOMC meeting, it will be at least a mild reinforcement of the reflation trade across assets (i.e. higher yields).

Get the simple talking points you need to strengthen your client relationships with the Sevens Report. Everything you need to know about the markets delivered to your inbox by 7am each morning, in 7 minutes or less. 

Could The Fed Give a Hawkish Surprise Today?, June 14, 2017

The Sevens Report is the daily market cheat sheet our subscribers use to keep up on markets, seize opportunities, avoid risks and get more assets. Sign up now for a risk-free two-week trial, and see how it feels to be in the know. www.7sReport.com

The simple answer is probably not, but there is a better chance than previous meetings because of one simple reason: Despite two rate hikes since December, in aggregate, “financial conditions” have gotten “looser” in 2017, so Fed rate hikes aren’t really working.

Financial conditions is a term that was coined (for all intents and purposes) after the financial crisis, so we could see financial conditions were getting very tight (i.e. less credit availability) and when liquidity was drying up.

Now, in a post-crisis world, multiple institutions keep “Financial Conditions Indices” that measure the level of interest rates, liquidity in the system, credit availability and other measures of whether the availability of money and credit is getting loose (i.e. more availability) or tight (less availability).

I watch three such indices: (withheld for subscribers—unlock with a free trial). All three have slightly different methodologies, but all generally try and accomplish the same objective, which is to see if financial conditions in the economy are “looser” (i.e. easier credit/more liquidity) or if they’re getting “tighter” (i.e. less credit and less liquidity).

Here’s the important takeaway: All three financial conditions indices have shown aggregate financial conditions getting looser since the start of the year. In fact, in aggregate, financial conditions have eased by the equivalent of a 25 basis point rate cut since 2017 started, despite two rate hikes.

The reasons for this are somewhat obvious: Liquidity remains ample; credit remains readily available, interest rates are down, the stock market and housing prices are up (so more ability to borrow).

From a Fed standpoint, the takeaway is this: The fact that the Fed’s “slow walk” in interest rates isn’t mopping up excess liquidity in the market may make the central bank more prone to get “hawkish,” which again would be positive for banks and cyclicals (i.e. the reflation trade), but negative for defensives and higher-yielding sectors (utilities, consumer staples, REITs).

Again, I’m not saying the Fed will be surprisingly hawkish today, but if I had to bet on a surprise based on these financial conditions indices, I’d bet hawkish over dovish (although I’m making the dangerous assumption the Fed is serious about getting rates back to normal levels).

Bigger picture, though, the takeaway here is that the Fed’s policies, so far, are not having the desired effect. And, if this continues, the Fed will have to “shock” markets with a substantial rate hike at some point if it wants to regain market related credibility—and that increases the risk of higher rates over the longer term (or, higher inflation if they don’t provide that shock).

Join hundreds of advisors from huge brokerage firms like Morgan Stanley, Merrill Lynch, Wells Fargo Advisors, Raymond James and more… see if The Sevens Report is right for you with a free two-week trial.