Sevens Report 7.16.14

Equities

Market Recap

Markets declined Tuesday as cautious comments from Fed Chair Yellen offset strong economic data, although stocks managed to close well off the worst levels of the day.  The S&P 500 fell -0.2%.

Tuesday initially started pretty well as futures were higher after several major companies beat earnings (GS, JNJ, CMA, JBHT, JPM) and economic data (June retail sales, July Empire State manufacturing) beat estimates.  The Dow Industrials hit a new all-time high, and the S&P 500 inched closer to its recent high, but markets reversed on the Yellen appearance before Congress.

I’ll cover it more in depth below, but Yellen’s comments caused the small caps and “momentum” sectors (biotechs and Internet stocks) to come for sale hard (you’ll see why in a minute), and that dragged down the entire market.

But, as has generally been the case since last Thursday, there was no real conviction or follow-through to the selling Tuesday. The S&P 500 bottomed down -0.5% shortly after midday, and then began a slow rally back toward flat before selling off slightly into the close.

Bottom Line

The market has been consolidating since the highs of July 7, and that continued yesterday.

The price action in small caps and momentum names is disconcerting, but most of the selling that’s going on in those sectors is by fast-money funds and algos, not real money materially reducing exposure (like we saw in April).  Europe has also been weak and likewise needs to be watched, but the fundamentals behind the market remain broadly positive.

All that said, I don’t think this period of consolidation is over just yet, and it wouldn’t shock me if we have another “scare” to the downside on some sort of negative news over the coming days.

Earnings are helping to support markets (although it’s still early), but I’d continue to like to see the SX7P (European banking index) bottom before buying back into Europe, and for the NBI and QNET (biotechs and Internet indices) hold the lows of last week before allocating anything further into SPHB and more-cyclical sectors.

Again, this looks like a normal consolidation to me (rather than a correction), but I don’t think it’s over just yet.

Yellen’s Testimony Wasn’t ‘Hawkish,’ But It Did Cause Stocks to Decline.

The general consensus of Fed Chair Yellen’s statement and Q&A in front of the Senate yesterday was that she was incrementally “hawkish.” But that wasn’t really the case.

The main sentence that was being spun as “hawkish” was her commentary that “if the labor market continues to improve more quickly than anticipated by the Committee … then increases in the Federal Funds rate target would occur sooner and be more rapid than currently envisioned.”

Translation: If the jobs market improves and inflation accelerates, we’ll pull forward when we raise rates and how quickly we raise them.

That’s not a hawkish statement – it’s common sense.

The reason the market traded down yesterday was thanks to a totally separate piece of information – the Fed’s semi-annual report to Congress.  It contained the statement that “valuation metrics in some sectors do appear substantially stretched – particularly those for smaller firms in the social media and biotechnology industries. … Moreover, implied volatility for the overall S&P 500 index, as calculated from option prices, has declined in recent months to low levels last recorded in the mid-1990s and mid-2000s, reflecting improved market sentiment and, perhaps, the influence of ‘reach for yield’ behavior by some investors.”

So, the Fed singled out bio-tech and social media as overvalued, and that statement echoes recent comments Yellen has made about pockets of “froth” in the equity markets. Importantly, though, she described the valuation of the broader stock market as “not far above historical averages,” so this was more about addressing the overvaluation in “momentum” sectors more than it was declaring the stock market “irrationally exuberant.”

The Fed signaling out “momentum sectors” is a unexpected headwind (the fear is a repeat of April where a sharp decline in those sectors drags the entire market lower).

But, and that’s not exactly new messaging, and more importantly, the bottom line is that the outlook for the Fed did not change in yesterday’s testimony (and likely won’t change today, either).

Economics

Both economic releases yesterday beat estimates and painted an encouraging picture for consumer spending and economic activity in July.  But, neither resulted in an equity-market rally, as comments by Fed Chair Yellen overshadowed the hard data.

Retail Sales

  • June Retail Sales rose 0.2% vs. (E) 0.6%.

Takeaway

June retail sales disappointed on the headline yesterday morning, but that was a bit misleading. The details of the report were good and there were positive revisions to April (0.5% from 0.2%) and May (0.2% from 0.0%). The “control” number — which is retail sales ex-autos, building materials, and gasoline stations — rose +0.6% in June, the 4th month in a row.

Bottom line, the disappointing headline of yesterday’s retail sales report for June was misleading and the report was actually pretty good. And, while not reflecting robust consumer spending, the strong June “control” figure and positive revisions will help ease some of the general concern regarding consumer spending.  This report was a positive for the economy.

Empire State Manufacturing Survey

  • General Business Conditions Index rose to 25.60 vs. (E) 17.80 in July.

Takeaway

Manufacturing activity accelerated to a 4-year high in the greater New York area in July. Both the headline and details of the report were good, as new orders (the leading indicator within the report) were little-changed but remain strong at 18.77.

Empire State manufacturing hasn’t been a very good predictor of the broader national manufacturing PMIs in 2014. Regardless, it’s encouraging for the market to see growth in the manufacturing sector continuing in July, especially in the context of constant worries about the strength of the manufacturing recovery.

Focus will now turn to the Philly Fed manufacturing index Thursday. But the bottom line is this first data point from July implies the recovery in the manufacturing sector is accelerating further and that’s anecdotally encouraging for the economy as a whole.

Commodities

Commodities were almost universally lower yesterday, in part thanks to a stronger dollar (+0.3%). The sole exception was copper, which was only slightly higher on better than expected Chinese economic data. The benchmark commodity tracking index ETF, DBC, fell to a 5-month low before bouncing slightly into the close.

Precious metals got hit again yesterday. Gold fell -0.8% while silver gave up a more-modest -0.4%. Nearly all of the session losses in gold came in the first 15 minutes of Yellen’s testimony (when her statement was released and then feverishly dissected by the news-reading algorithms). Gold smashed through support in that $1300—$1310 range in heavy selling before finding support in the $1290 region.

Gold futures were able to hold the 50-day moving average at $1,292.40. But the reason it was defended was more a result  of shorts taking profits rather than new longs initiating positions. Bottom line, it appears that the broken uptrend line was more important over the near term than initially expected. Despite the 3 other supporting factors in the market (the bullish cross in the moving averages, the rising number of net longs, and the underlying inflation bid), the bears still have the momentum and we could see a further dip or at the very least some further consolidation here below $1,300.

Elsewhere in metals, copper was the only commodity to finish higher yesterday, adding a very modest +0.05% thanks to some better than expected economic data. A Chinese report showed that lending increased at a higher than expected rate last month, which helped reverse losses ahead of the release.

Going forward, prices remain somewhat extended as the recent rally from $3.00 was a sharp one; therefore we’d like to see a further pullback to around $3.20 before the risk/reward would be favorable to initiate long positions in copper. But, looking ahead, the improvement in the global economy will continue to be a tailwind on copper prices as a result of higher demand.

Crude oil futures resumed their downtrend Tuesday after seeing a bounce on Monday. WTI fell -1.01% yesterday but importantly held support at the 200-day moving average ($99.81). But, WTI still has some significant downside momentum and until we see a break of the sharp downtrend that has been in place since the mid-June highs, we will remain sidelined. Such a break would require a close above $101.25.

Fundamentally, today is inventory day for crude oil and the products, and a bullish report may facilitate a short-covering rally and a close above the aforementioned technical level. Expectations are:  -2.6M bbls in WTI Crude, 700k bbls increase in RBOB Gasoline, and + 2M in distillates.

Natural gas traders retested trend support at the $4.10 level yesterday as futures fell -1.3%. Like crude oil, natural gas also remains a “falling knife” here. Even though the risk/reward setup for initiating a long here is favorable, like in WTI crude there is significant downside momentum in the very short term, and we would like to see a close above the steep downtrend line (above $4.15 or so) before initiating a long position.

Currencies & Bonds

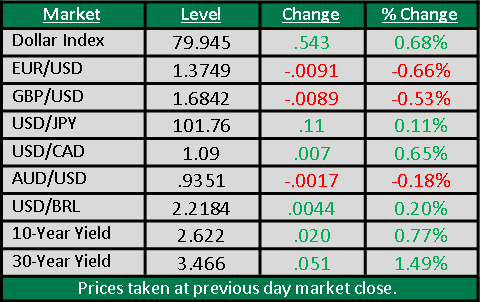
The dollar was nearly universally stronger yesterday courtesy of the good economic data (retail sales and Empire State manufacturing survey) and a “hawkish” take on Yellen’s testimony.  The Dollar Index rose +0.27%.

The only major currency that ended the day higher vs. the dollar was the British pound, as it rose +0.39% to (just off a new 6 year high) after Great Britain June CPI rose to 1.9% year-over-year, much higher than the 1.6% consensus.

The headline jump in inflation year over year was a bit eye-popping, but it’ll probably prove temporary.  That’s because the spike higher was caused by price increases for footwear and apparel.  But, the increase will likely be temporary because of seasonal adjustments. Normally, retailers in Great Britain heavily discount summer clothing in June, so the seasonality anticipates this discount.  This year, though, the retailers appear to have not as aggressively discounted in June, and will likely spread out discounts over the summer months.  So, that should result in some seasonality “payback” in the form of price declines in July/August.

Regardless, clearly inflation is trending higher in the UK, as is economic growth. This is just reinforcing the point that the Bank of England will be the first major central bank to raise interest rates, perhaps as early as this year.  The pound remains the single-most-attractive currency vs. the dollar right now.

Staying in Europe, the euro was almost the worst performer vs. the dollar yesterday, falling -0.38%, on a combination of factors:  dollar strength, a German ZEW Business Expectations Index miss, and “dovish” comments by ECB President Mario Draghi (he said a strong euro is a threat to growth and that asset purchases (QE) are well within the scope of the ECB).  None of the comments were new, but Draghi wanted to try to talk the euro down and appears to have been moderately successful (the euro is down again this morning and through support at 1.355).

Keep in mind, a weakening euro is what the “Europe bulls” want right now, so a declining euro is a needed tailwind for European shares, if it continues.

Looking at the commodity currencies, the Loonie was the worst performer vs. the dollar yesterday, falling -0.4% ahead of a manufacturing report earlier today.  The Loonie is now sitting on key support at $0.9260, and if that’s broken, look for the declines to accelerate. The Aussie was also slightly lower vs. the dollar after the Reserve Bank of Australia’s June meeting minutes were taken as slightly “dovish” in tone. (Nothing shocking was said; just general mention of concern about the economy.)  But, the Aussie remains in the middle of the trading range ($0.92-$0.94).

Turning to bonds, the 30-year traded in a big range yesterday. It initially traded down nearly -0.3% on the strong economic data and Yellen comments, but then rebounded and rallied nearly +0.3% later on in the testimony, before giving back those gains to finish basically unchanged.  Meanwhile the yield on the 10-year was also unchanged.

Treasuries remain buoyant but seem a touch confused at the moment, as the market tries to “game” the Fed’s potential normalization strategy within the context of foreign demand for Treasuries, an accelerating economy and bottoming inflation.  And, in the near term, money flows from the two aforementioned sources are trumping the fundamentals of the two latter sources.  Bottom line is that Treasuries remain above the uptrend of 2014. Until they decisively break that downtrend, then the short-term benefit of the doubt remains with the bulls, despite growing fundamentals that suggest Treasuries should be declining.

Have a good day,

Tom


Sevens Report 7.14.14

Equities

Market Recap

Stocks declined last week as soft global economic data led to a round of profit-taking in small caps and higher-beta sectors.  The S&P 500 fell -0.90% and is up +6.45% year-to-date.

Stocks traded lower last Monday mainly on European growth concerns after Erste Bank became the latest European bank to issue a profit warning. The selling continued Tuesday as European banks were again lower on news that BNP Paribas was hit with a $9 billion fine and Commerzbank may be next.

Also contributing to the selling early last week was news that a subsidiary of Banco Espirito Santo (Portugal’s largest bank by assets) would miss a debt payment and may be having funding troubles (which was extrapolated out to imply the larger company may also have funding troubles).

Stocks saw an oversold bounce Wednesday helped by better than expected AA earnings and positive margin guidance from AAR. But it was a weak bounce, and the selling pressure resumed Thursday as the S&P 500 was down over 20 points very early in trading, dragged down by Europe.

Stocks lifted off those early morning lows to finish down modestly Thursday as there wasn’t a lot of follow-through or conviction to the selling, and an earnings beat by WFC helped stocks bounce slightly Friday in quiet trading.

Trading Color

One of the bigger takeaways from last week’s selling was that it was much more about profit-taking than it was some broad “risk off” move by investors, although obviously defensive groups outperformed higher-beta names.  Utilities, consumer staples and REITs finished positive last week, and more broadly SPLV (which was flat on the week) handily outperformed SPHB (down -2%).

The reason I say the selling last week was much more about profit-taking than anything else was because sectors that have outperformed handily since May (momentum sectors like bio-techs and internet stocks) got hit hard, as did small caps (the Russell 2000 fell -4% last week as it was weighed down by financials, which were sold ahead of earnings, and the aforementioned biotech and Internet names).

The reason this distinction is important is because profit-taking-driven selling implies this is more of a consolidation in the markets rather than some sort of a bearish game-changer. Sellers weren’t aggressive last week despite the declines.

Two other observations from last week:  First, not all cyclical sectors got hit, as PICK hit a new 52-week high last Tuesday (helped by AA earnings), and metal & mining stocks bucked the broader market’s negative trend as gold traded higher (GDX was up over +3% last week).  We could see those sectors dip this week as they are short term overbought, but valuations in the global mining sectors aren’t extreme, and there’s plenty of upside from here as long as metals prices hang in there and we don’t get any materially negative data from China.

Second, energy was a standout underperformer last week, weighed down by WTI crude prices.  The XLE chart looks pretty bad at this point, as does FCG and XOP.  And, while I remain an energy bull, it looks like this selling has a bit further to go.

Looking at market technicals, the Russell badly violated support last week and traded out a weekly negative “outside reversal,” which will have people nervous.  The S&P 500 held support at the 1,964-ish level and that will be key again next week, while next support sits below at 1,950.

Bottom Line

Last week’s sell-off appears to be a normal correction in an upward-trending market more than it is the end of the rally.  Stocks have enjoyed a strong and uninterrupted rally since mid-May, and at this point need to consolidate and correct to restore some health.

The soft European economic data and European bank weakness appear to have just provided the catalyst for that normal correction to start, and it likely will last a bit longer depending on earnings season, which kicks into high gear this week.

More broadly, the “4 Pillars” of the rally remain largely intact:  globally accommodative central banks, an ongoing global economic recovery, a calm macro horizon, and still-reasonable valuations.

Risk remain to each of those pillars (Yellen speaks on monetary policy Tuesday, the global economic data have softened slightly lately, Israel is threatening to put ground troops in Gaza, and earnings need to confirm $130/share 2015 EPS).  But, at this point those are just risks to monitor.

Focus this week turns to earnings, but Europe will also remain the key.  I want to be a buyer of cyclicals and Europe on this dip, but I want to see the SX7P (European banking index) stabilize first—as I think that’s a leading indicator of when this correction will end.

Economics

Last Week

The biggest thing that happened last week, economically speaking, was that foreign data largely disappointed, and implied we’re seeing the global recovery lose a bit of momentum.  That, much more than concern about Portuguese banks, was the real reason global shares traded heavily last week.

Chinese trade balance (both exports and imports); German, French and Italian May industrial production; and Japanese machine orders in May all missed expectations. Specifically in Europe, the soft data added to a string of indicators that implied the recovery, while still ongoing, is losing some momentum.

Keep in mind that one of the “four pillars” of the rally is a broad global economic recovery.  And, while the data last week didn’t imply the recovery is stalling, numbers in Europe have been soft now for a few weeks. So, the global markets now need a bit of a confidence boost that the EU economy is indeed continuing to get incrementally better.

Domestically last week was very quiet, as FOMC minutes from the June meeting were in focus.  Going into the release of those minutes, it was expected they may be more “hawkish” than the FOMC statement because it was assumed the FOMC would have been extensively discussing exactly how they were going to start to unwind all this historic stimulus.

But, as seems to be the case lately, the market overestimated the Fed’s concern about both inflation (which the broad committee doesn’t see as a problem right now) and the economic strength (the Fed remains committed to being very accommodative into the future).

Some details of just how the Fed plans to eventually raise rates were discussed, but the Fed seems in the very preliminary stages of figuring out how they will eventually raise rates.

The one big headline out of the minutes was that the Fed will likely end QE in October, but that wasn’t a surprise to anyone who’s been paying attention.  Bottom line with the minutes last week was that they weren’t as hawkish as feared, and there were no changes to expected Fed policy.

This Week

The calendar gets busy again this week as we get several pieces of economic data and Fed Chair Yellen conducts her “Humphrey-Hawkins” testimony in front of the House Tuesday and Senate Wednesday.

Given the focus on the Fed and the expected transition in policy, the Yellen testimony Tuesday will be the highlight of the week. (Her prepared comments will be the same for the Senate testimony, so Wednesday all that matters is  the Q&A session.)

The highlight of the week from a data standpoint will be retail sales.  Consumer spending hasn’t been as strong lately as you would have expected, given the improvement in the labor market. Combined with recently dire commentary on the consumer from some companies (The Container Store last week was the latest to lament a poor retail environment), retail sales will be closely watched to see if the consumer is starting to increase spending.

Second in importance this week will be the first look at July data, via the Empire State Fed manufacturing survey (tomorrow) and Philly Fed manufacturing survey (Thursday).  As I’ve said before, these regional manufacturing surveys have lost some importance since the national flash PMIs started being produced, but the market will want to see that the pace of the economic recovery is continuing in July.

We also get our first look at the June housing data, as housing starts come Thursday.  Recent indicators implied the housing market is finally rebounding from the winter declines, and another good round of housing data will help further reduce concerns about the pace of the housing recovery.  Finally this week we get May industrial production and the Fed Beige Book.

International data will also be in focus this week given recent concerns about the strength of the recovery, especially in Europe.  There’s not a lot of data from the continent this week, but the German ZEW Survey will be in focus, especially given the recent weakness in German economic data.

In China we get the latest look at GDP, industrial production, fixed-asset investment and retail sales Tuesday night.  Obviously the key here is that the pace of Chinese economic growth remains stable.  As long as the numbers are mostly “in-line” with expectations, the market shouldn’t react too much.

Broadly this week, the market is looking for Yellen to not say anything surprising and to emphasize that any transition to policy “normalization” will be gradual.  From a data standpoint, markets need a bit of a confidence boost, mainly from the EU, but also from China and the U.S.

Commodities

Commodities finished last week mostly lower, led down by continued weakness in the energy sector as WTI crude oil futures fell a staggering 3.16%. DBC, the benchmark commodity tracking index ETF, had its worst week of the year, falling 2.5%. However, one bright spot despite the fairly broad weakness in the space was the continued outperformance of precious metals.

Beginning with energy, crude oil futures crashed through several support levels over the course of the week, starting with the 50 day moving average at $103.60, then the 100 day MA at $102.39, and lastly trend support at $101.25.

As for a reason for the substantial selling pressure, several things were citied including easing tensions in Iraq and increasing exports from Libya. However, these were more excuses to explain the overwhelming momentum that the bears have at the moment rather than actual market driving headlines. All eyes are now on support at the 200 day moving average at $99.96 and the sharp downtrend line that futures have been riding since they topped out in mid-June.

Elsewhere in energy, natural gas futures also continued to sell off last week, falling 5.1%. But, unlike WTI, the selling in natural gas futures lightened up on Friday, and actually closed higher by .5% and importantly, 4 cents above support at $4.10. Cooler weather forecasts and growing inventories are the main reasons for the short term weakness, and despite inventory levels remaining historically low, the outlook for weather remains the driving factor in the near term.  But, natural gas is nearing key medium/longer term support levels.

Moving to the outperformers, gold and silver both rallied 1.4% on the week. Both precious metals saw gains mid-week thanks to a “safe haven” during the Portuguese debt flare up. Both gold and silver are trading a bit lower this morning as equity markets bounce, but beyond the near term noise, gold and silver continue to benefit from general global unrest, rising inflation expectations and declining real interest rates.

Gold is now sitting on the uptrend in place since early June, so for those looking to trade it, buying this dip makes sense on the charts.  Use a tight stop though ($1316ish).

Currencies & Bonds

The Dollar Index was flat last week, as the greenback initially declined in response to the “dovish” FOMC minutes, but then caught a bid late in the week on a “risk off” bid.  The Dollar Index did manage to hold support above the 80 level, despite the choppy trading.

The euro also was surprisingly flat despite general risk reduction, disappointing data and Portuguese banking worries.  Oddly, though, euro strength is now a reflection of things not “working” in the EU.  The goal of the ECB (and the euro bulls) is to see the EU economy grow, bond yields rise gradually, and the euro fall.  But, when the market doesn’t think the ECB policies are working or the economy is growing, they will buy euro out of deflation fears.  So, trading in the euro is not all that dis-similar from the yen at this point—a weaker euro is a sign things are “working” in Europe.  Clearly, things weren’t working last week.

Turning to the yen, things aren’t working there, either.  The yen rallied to a 5-month closing high vs. the dollar despite weak economic data (again, the yen is pricing in potential low inflation/deflation concerns).  100.74 remains the key level to watch in the dollar/yen—if that is violated, then calls that “Abenomics” is failing will get louder, and we’ll have to significantly re-evaluate the “long Japan” thesis.  I can’t believe, though, that the BOJ won’t try to put pressure on the yen as there’s a BOJ rate meeting early this week.

The bond market surged higher last week and completed one enormous head-fake, as the 30-year is now just a few ticks from the highs for the year.  Lackluster economic data, a dovish Fed, and foreign buying helped push bonds higher. Astonishingly this uptrend isn’t over.  138’10 is the high for the year, and I’d be very surprised if that isn’t tested early this week.  At some point this bond rally will end, but I’m now becoming convinced that it won’t be until ECB policies in the euro zone start “working” and this enormous Treasury carry trade starts to reverse.  Until then, the short-term trend remains higher.

Have a good week,

Tom


7:00’s Report Editor Tom Essaye Discusses Gold Miners on Fox Business 6.23.14

Tom Essaye discusses the outlook for the broad market and the potential for a continued rally in gold mining stocks on FBN’s Varney & Co. with Stuart Varney.

http://video.foxbusiness.com/v/3637800558001/time-to-buy-gold-miners/#sp=show-clips

Your Weekly Economic Cheat Sheet 5.12.2014

Last Week

With the exception of the ECB, it was more of the same last week as economic data from the U.S., the EU and China confirmed what the market currently assumes and has priced in.  Those assumptions are that:   U.S. growth is recovering from the temporary winter drop, and 3% annual GDP growth is consensus. The EU economy is seeing the recovery accelerate slowly (but overall economic growth remains weak). Economic growth in China is showing signs of stabilizing (so 7.0%-7.5% GDP growth is still to be expected).

Looking at last week’s data, reports were light in the U.S., but as mentioned, the reports we did get were good.

ISM non-manufacturing PMI was 55.2, the best reading since August, and that strong data helped reverse a big decline (over 100 points) last Monday in the Dow.

Additionally, weekly jobless claims declined to 319K, and appear to have resumed the downtrend we were seeing prior to the Easter/Spring Break “noise” in the number.  And, if that trend of lower claims continues, it’ll continue to imply we’re seeing incremental improvement in the labor market (obviously a positive for the economy).

The Yellen testimony in front of Congress was in focus last week. But while some in the media were trying to spin her comments as a slight downgrade on the outlook for the economy, they really weren’t. Her comments didn’t give anyone any reason to change their outlook for Fed policy (tapering ending October/December, with the first interest rate hike coming in mid-2015).

In China, composite PMIs were in-line (importantly the service sector PMI stayed above 50 at 51.4). Meanwhile, the April trade balance was the positive surprise of the week, as both exports and imports increased small vs. expectations of a 3% monthly drop for both.

We get more Chinese data this week, but if it can confirm what we saw last week, it would make a very good case that the Chinese economic growth pace is stabilizing. (This is important because we may be able to get long “China” and also because it’ll remove the macro risk of a Chinese “hard landing.”)

The “biggest” event of the week was the ECB meeting last Thursday.  As expected, there was no change to policy, but ECB President Mario Draghi’s comments during the Q-and-A (he stated that the Committee was “comfortable acting next time”) commanded the market’s attention.

We knew Draghi would again try to rhetorically ease policy, but no one expected this amount of specificity.  And, it worked. The euro collapsed late last week, and everyone is penciling in either a rate cut in June, or the introduction of negative deposit rates. (QE, however, remains well off in the future.)

Graph 512

This Week

This is a busy week of data on the calendar, but I don’t expect any of it to materially change the market’s economic assumptions about the U.S., EU or China, unless the numbers are simply horrid.

In the U.S., retail sales tomorrow are the highlight, followed by industrial production Thursday. Although economic data have been strong, the inexplicable strength in the bond market and U.S. dollar weakness are keeping concerns alive about growth going forward.  So, to a point, the market has a confidence problem, and each number that comes in better than expected (especially in April) helps to re-affirm that the economy is indeed seeing the recovery accelerate.  So, retail sales and IP are important from a confidence standpoint.

We also get the first look at economic activity in May, via the Empire State and Philly Fed reports (both Thursday).  These two first looks have lost some significance now that flash PMIs are released for the U.S. (they come next Thursday), but still they are watched because it’s the first data for the current month.  Philly has been the better predictor of national manufacturing activity lately, so pay more attention to that one.

Internationally, China releases April retail sales and industrial production tonight, and again the market is looking for further signs of stabilization.  In Europe there are several pieces of data, but again unless the news is horrid, it won’t really change anything as the entire focus of Europe is on what the ECB will do at the June meeting.

The Economy: A Look Back and What’s Ahead (1.21.14)

Last Week

Economic data last week was almost universally better than expected. This gave the market a needed “confidence boost” about the current state and trajectory of the economy following the disappointing December jobs report.

First, with regard to the current state of the economy, the first two January economic data points, Empire State manufacturing and Philly Fed, both beat expectations.  Importantly, given the context of the jobs report, the employment indices in both reports saw strong gains from December to January (Philly jumped 5.6 points to 10.0 while Empire jumped from zero to 12).

Turning to the trajectory of the economy, several pieces of December data helped remind the market that we are seeing economic growth accelerate.
Read more

Is the UK Providing A Blueprint for a post “QE” World?

As we approach the jobs report later in the week, we need to be mindful that the greatest risk from an economic data standpoint isn’t of weakness, but instead inordinate strength, which could then sow the seeds of the market doubting “ZIRP.”  It wouldn’t mean that stocks would sell off immediately, but as we look out over the coming weeks and months, the risk of the market losing confidence in ZIRP is the biggest threat to the stock market, and the better the economy gets, the higher the chances.

Luckily, though, we have a bit of a leading indicator for what might happen if and when the market does begin to lose confidence in the Fed’s ZIRP.  The UK is somewhat of a “blueprint” for what we can expect here in the US, now that the Fed has started tapering QE and is relying more on “Forward Guidance” as a policy tool.  The UK shifted its policies away from QE to “Forward Guidance” over the past year, and that has resulted in higher stock prices as the economy improves, higher bond yields and a stronger Pound (sound familiar?).
Read more

Fed Pivot to Forward Guidance Furthers Bear Case for Bonds

I remain skeptical of the “power” of forward guidance and think the switch away from QE to forward guidance as a primary policy tool only furthers the bearish case for bonds.  And, my skepticism is rooted in experience and observation.

Although the rise in the Dollar Index yesterday got a lot of press, the one currency that was stronger vs. the dollar yesterday was the British Pound, which saw a 0.8% rally vs. the greenback—and that’s something that shouldn’t be dismissed, because I believe that what’s happening with the Pound, the FTSE and UK Bonds, may provide us a “road map” of sorts for what will happen to the Dollar, Bonds and stocks, now that the Fed is switching to “forward guidance” as its primary policy tool.
Read more

What Could Go Wrong in ‘14—A Thought Experiment

As I start to think about the outlook for 2014, my mind almost always wanders first to “what could go wrong in the financial markets this year?” Having been raised in this business as a trader, I learned early that avoiding disaster is the first step to making money.  So, I’ve spent some time thinking about what could go “wrong” in 2014.

Maybe I’m just a product of my environment, but I entered this business in the dot-com bubble burst of the summer of 2000, started on the floor one year after 9/11, and after a few good years then ran smack into the financial crisis.  So, despite my relative youth, I’ve seen a lot of mess over a relatively short time.

Now, in fairness, the macro-horizon is as “clear” as it has been for some time.  Europe is no longer teetering on the brink of a breakup or massive sovereign default.  The financial system and banks are well-capitalized and as healthy as at any time since the crisis.  Even the U.S. government appears to be trying to behave, as we’ve got a budget for the next two years (and the debt ceiling won’t be a drama in an election year—I don’t care what the Republicans say now).  So, all things considered, the horizon looks pretty clear.

But, as I look for places where something could go “wrong,” I keep coming back to the bond market.  I don’t think there are many people who would argue that the bond market, in general, reached “bubble” territory (or at least a blow-off top of a 30+ year bull market) over the past few years.

There are multiple measures to imply this is the case, whether it’s the amount of assets that have poured into the bond market, the amount of corporate issuance, or risk spreads compressing to historic lows, etc.

But, importantly, a declining bond market, by itself, doesn’t mean a crisis.  Bonds can go down like any other asset and not cause a crisis that infects other asset classes.  But, what makes me nervous about a crisis emanating from the bond market is the fact that we have a market in a blow-off top that was largely manufactured by government policy (the Fed), combined with government-mandated structural changes to the industry that has drained liquidity and will likely have multiple unintended consequences. (I’m referring to Dodd-Frank.)

And, this sort of dangerous cocktail should sound familiar to people.  The potential negative consequence of this, of course, is a stampede to the exit by investors, but no one to buy the dip—causing a liquidity crisis in the bond market, and specifically the corporate bond market (with ground zero potentially being the high-yield market).  And, the potential set-up is for a liquidity crisis in the corporate bond market that infects all other asset classes (like subprime did to everything else).

Throw in the explosion of bond-related ETFs and the retail money that’s flooded into them, and I can imagine a scenario where there is lots of selling of these ETFs and mutual funds. This in turn results in the bonds themselves having to be sold, but there simply being “no bid” for the specific corporate bonds, which then breeds a liquidity crisis that begins to feed on itself.

This report isn’t the venue for an in-depth analysis of the risks, but a client sent me an excellent report by McKinsey on this subject (I’m lucky to have a lot of smart people as subscribers), and the link is here.  We got a warning shot on this in May/June of last year, and this is a concern that is starting to make the rounds among smart people.

I’m not a Pollyanna, but as I think of risks coming out of left field that could result in an end to this rally, this is the one that keeps popping up in my head.  Again, this is a very, very low probability scenario, and one that likely won’t ever come to fruition. But if we’re looking for something that could go wrong next year, the pieces are in place.

Heres’s Why The Plunge in the Indian Rupee Matters To You

In May and June, when markets initially declined on the prospects of Fed tapering, I pointed out to my clients two very important things we all needed to keep in mind as the market started to adjust to the reality of higher interest rates in the future.

First, it’s the pace of the rise in interest rates that’s important, not the absolute level.  So, the stock market can rally along with interest rates, as long as the pace of the rise in interest rates isn’t too fast.

Second, emerging-market debt is now the “leading edge” of any potential market turmoil, as that sector has replaced Europe as the “weakest link” in the global financial system.  Stable emerging debt markets are a pre-requisite for any sustainable rally in stocks.

With that in mind, after we saw an initial shock in May/early June, the pace of the increase in interest rates leveled off, and emerging-market debt stabilized—which allowed the stock market rally to new all-time highs.

But, over the last week, emerging debt markets have quietly begun to break down again as the pace of the rise in interest rates here in the U.S. has quickened substantially. (The 10-year yield went from a low of 2.55% last Monday to a high of 2.899% yesterday.)

In reaction to that acceleration, emerging-market bonds—as measured by the PowerShares Emerging Markets Sovereign Debt ETF (PCY) and the iShares JPMorgan USD Emerging Bond Fund (EMB)—have declined sharply, and are now dangerously close to breaking down.

As a refresher, I’ve included an excerpt from the June 12 Report that explains why emerging-market debt poses a potentially significant risk to the market (below):

Why The Plunge In the South African Rand Matters to You (June 12th 7:00’s Report).

“Away from the yen, the other focus in the currency markets was on the implosion we’re seeing in emerging-market currencies.  The Indian rupee hit another all-time low vs. the dollar. The Brazilian real and South African rand hit four-year lows vs. the dollar, and even strong currencies like the Mexican peso got hit yesterday. 

“The reason for the weakness is this:  Since the Fed went to 0% interest rates and round after round of QE, investors have moved into higher-yielding emerging-market currencies over the past few years. 

“Now with the Fed potentially ‘tapering’ and interest rates in the U.S. rising, investors are reversing the trade. They no longer need to take the risk of being in emerging markets, as rates are rising here at home. 

“That’s causing the currencies of those emerging-market countries to drop as investors sell their bonds and reconvert those investments back into dollars.  Basically, ‘doomsayers’ are saying the world’s major central banks, led by the Fed, have created a bubble in emerging-market credit, and now it’s popping.

“The question I’m sure you’re asking right now is ‘Why the hell do I care about emerging-market credit?’  Well, you care because, as these currencies and bonds plunge, it’s causing losses in the leveraged hedge funds that have put the trade on. That’s causing them to liquidate other holdings to cover the losses (like stocks and gold, for instance). 

“Point being, you should care for the same reason everyone should have cared when the mortgage-backed security markets started blowing up in ‘07, ‘08 and eventually led to the takedown of Bear, Lehman, etc.  I’m not saying it’s the same thing here at all—but it’s the leverage and the huge declines that are making people nervous. 

“So, while it’s not a disaster yet, this unwind out of emerging-market debt and currencies is having an effect on all asset classes.  It’s not anywhere near 1998-style proportions yet (the emerging-market debt crisis), but it is unnerving investors, and weighing on other risk assets.  Bottom line is watch PCY and EMB, the two emerging-market bond ETFs. Emerging-market bonds need to stabilize in order for equity markets to calm down a bit.”

Bottom Line

The market dynamic may have changed a bit Monday, and for the worse.  The acceleration in the rise in interest rates is causing another round of turmoil in the emerging markets. And, as stated, a stable EM debt market is a requirement for any rally in the global equity markets.  If emerging-market bonds can’t stabilize at these levels and they take another leg lower, then stocks are going to follow them down, regardless of the positive economic momentum in Europe China, etc.

My optimism on equities has been consistently hedged with the statement “if the macro environment stays relatively clear.”  Well, an emerging-market currency/debt crisis doesn’t constitute a “relatively clear” macro horizon, so emerging markets need to stabilize before equities can resume their rally.

Keep an eye on PCY and EMB—if they break down to new lows, that’s a sign to get defensive with regard to domestic and international equity exposure.

I wouldn’t sell yet as EM bonds haven’t made new lows, and keep in mind the EM inspired dip in June turned out to be a buying opportunity.  But, this is a potential game changer if we get a sustained move lower in the emerging markets, so I’d certainly get a plan together about just how I want to de-risk if EM bonds break down further.

The Economy: A Look Back and What’s Ahead

Last Week

If economic data had been “Goldilocks” (meaning good, but not so good that the Fed would “taper” QE early) domestically during the past two months, then last week’s data was decidedly “anti-Goldilocks.” (It wasn’t bad enough to remove the prospects of tapering, but it wasn’t good enough to give people confidence the economy can keep growing if the Fed pulls back.)

Retail sales were basically flat last week, meeting low estimates.  The first look at August manufacturing data via the Empire State and Philly Fed reports showed continued expansion but at a slower pace than July.  Jobless claims fell to the lowest levels since October ’07, implying we’re seeing incremental improvement in the labor market, and the Consumer Price Index rose slightly. But it has been increasing for three consecutive months, which is helping to ease some fears about dis-inflation.

So, the latter two reports helped solidify the expectation of “tapering” being announced at the September Fed meeting. Meanwhile retail sales, Empire State manufacturing, Philly Fed, Industrial Production and Friday’s new home sales (which met expectations) basically showed an economy that’s still expanding, but at a slower pace than the previous few months.

Bottom line: The data rekindled the market’s primary fear that the Fed has to taper QE because of the potential negative side effects they risk by keeping it going, but that the economy isn’t strong enough to handle the rise in interest rates that will accompany the tapering of QE.  The economic data last week didn’t directly imply that’s what’s happening, but it certainly made people think about it. With the S&P 500 up 18% year-to-date, that’s a reason to de-risk a bit, which is what happened.

The opposite was true in Europe, as the data there almost universally showed the EU economy is indeed starting to turn, although many investors remain skeptical.  EU GDP turned positive thanks to strength in Germany and France, while the ZEW index, German industrial production, UK retail sales and labor market report were all better-than-expected.

So, from a rate-of-change perspective, last week implied that the EU economy is actually outperforming the U.S. economy. The data there implies an acceleration while the data here implies continued recovery, but at a stagnant pace—meaning, we may see continued outperformance from EU markets over the near term.

This Week

There isn’t a lot of data this week but what’s reported is important, and this is by far the most important week of the month from an economic and a WWFD (What Will the Fed Do) perspective.

The headline this week is the global flash PMIs from China (Wed night) and the EU and U.S. (Thursday morning).  International markets and basic materials have outperformed thanks to better economic data internationally, and this trend needs to continue for those markets to rally further.

The next most-watched event this week will be the FOMC minutes, as investors will parse the release for insight into whether tapering will be announced in September, October or December.  Right now the consensus remains on a September announcement, but that’s no sure thing.  Anything beyond September will probably be taken as peripherally “dovish” by the market. The important thing to keep in perspective here is that the Fed is tapering, whether it’s in September, October or December.

We get more housing data also this week in the form of existing and new home sales (Wednesday and Friday respectively).  The new home sales figure was “OK” and the market will welcome more signs that the housing recovery isn’t losing too much positive momentum in the face of higher mortgage rates.  It is very important for the market that housing doesn’t show signs of backtracking.

Finally, weekly jobless claims will be watched to see if the six-year low set last week sticks, or if there are some big revisions.  Regardless, the anecdotal evidence implies the job market is incrementally improving, and that supports the September taper argument.

Internationally, it’s quiet outside of the flash PMIs, as most of Europe will be on “holiday.”

This could be an important week with regard to resolving what’s expected of the Fed and specifically answering the question of whether or not we will see tapering announced in September.

One important thing to remember, though, as the week unfolds:  Good economic news is still good for the market, regardless of the very short-term reaction.  Better economic data is the only way this rally has legs over the medium and longer term—if the market sells off on good data, then that’s probably a place to nibble on the long side.