Sevens Report’s Tom Essaye appeared on Cheddar on December 12, 2018
Sevens Report’s Tom Essaye appeared on Cheddar on December 12, 2018. He breaks down how Trump’s optimism on trade talks, and impacted the markets.
Watch the entire clip here.
Sevens Report’s Tom Essaye appeared on Cheddar on December 12, 2018. He breaks down how Trump’s optimism on trade talks, and impacted the markets.
Watch the entire clip here.

Sevens Report’s Tom Essaye quoted in USA TODAY on December 4, 2018. Read the full article here.
What’s in Today’s Report:
Futures are slightly higher as more positive U.S./China commentary was offset by Brexit upheaval.
The outlook for U.S./China trade continued to improve as it was confirmed “high level” talks are occurring. But, that positive was offset by Brexit turmoil as the British Brexit Minister resigned over the proposed deal. The Brexit upheaval isn’t a material macro headwind, but it can be filed in the “things this market didn’t need right now” category and it’ll add to volatility.
Fed Chair Powell’s comments after the close were a non-event (he acknowledged some mild softening of economic momentum but didn’t hint at any shift in the policy outlook).
Today there is a lot of important economic data to watch (in order of importance): Retail Sales (E: 0.5%), Empire State Manufacturing Index (E: 20.0), Philly Fed (E: 20.0) and Jobless Claims (E: 215K). There are also multiple Fed speakers today including Quarles (10:00 a.m. ET), Powell (11:00 a.m. ET), Bostic (1:00 p.m. ET), Kashkari (3:00 p.m. ET) but I don’t expect any of them, including Powell, to reveal anything new.
Finally, I’ll be joining Liz Claman on Countdown to the Closing Bell on Fox Business today between 3:00 – 4:00 pm ET to discuss the outlook for this market.
Supplies in storage “have fallen out of the five-year maximum-minimum range as stockpiles did not build as fast as most analysts had expected this summer,” says Tyler Richey, co-editor of commodity research provider of Sevens Report. “The last time inventories tested the lower end of that five-year range was at the beginning of the year, when futures spiked to a more than one-year high.”
Read the full article from Barrons here
The Federal Reserve appears ready to hike interest rates Wednesday for the third time this year, as the central bank responds to rising inflation and robust hiring by U.S. employers. “Something pretty significant would have to happen for the Fed not to hike in December,” said Tom Essaye, founder and editor of The Sevens Report.
Click here to read the full article.
Aug. 29, 2018 – 3:35 – Sevens Report Founder Tom Essaye discusses the S&P 500’s bullish run and the U.S.-China trade debacle.
It was another very quiet August night in the markets as US futures are flat this morning while European shares are slightly lower and Asian indexes continued to advance modestly with trade negotiations still the major focus.
The German GfK Consumer Climate edged down 0.1 to 10.5 vs. (E) 10.6 in September. Sentiment in Europe is not quite as strong as the US, but it remains mostly upbeat and strong enough for continued equity gains in the medium term.
Oil prices are slightly higher this morning despite the API reporting a slight build (+38K bbls) in crude stocks vs. (E) -1M bbls ahead of the weekly EIA report this morning.
Today, trade will continue to dominate the headlines but there are two economic reports to watch: GDP (E: 4.0%) and Pending Home Sales (E: 0.0%). There are no Fed officials or other central bank events so from a catalyst standpoint, it will likely be another quiet session.
The dollar has been a good inverse proxy for trade sentiment recently so if we see a continued pullback, stocks can continue to flirt with new highs, however any material rebound in the dollar index today will likely pressure US shares (the greenback is slightly higher so far).
Finally, I’ll be joining Liz Claman on Fox Business’s “Countdown to the Closing Bell” this afternoon at 3:00 p.m. ET to discuss the outlook for the markets and opportunities for investors as we head into the final four months of the year.
The Sevens Report is everything you need to know about the markets, in your inbox before 7am, in 7 minutes or less. Sign up now and get a free two-week trial.
Below you’ll find six charts, spanning asset classes and economic data.
The charts are divided up into two groups.
Group 1 is comprised of four charts that explain why stocks have rallied so nicely in 2017, and why, in the near term, the trend in markets is still higher.
Group 2 is comprised of two charts that look into the future, and show that despite a bullish set up right now, there are real, serious reasons to be worried about how long this rally can last. Point being, these indicators are telling you not to be complacent!
Group 1: Why Stocks Have Rallied
Chart 1: Economic Data
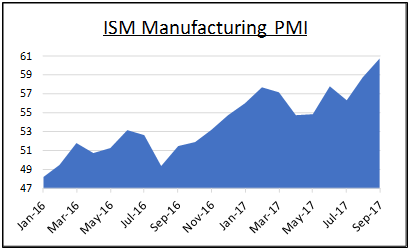
Chart 2: Earnings Growth
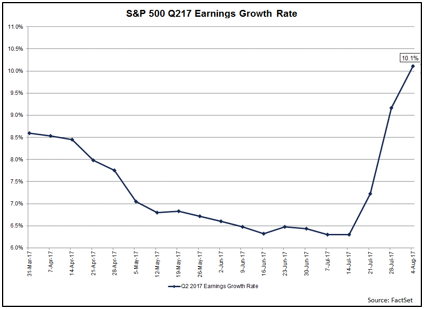
Earnings and Economic Data – The Unsung Heroes of 2017
We have said since the early summer that an acceleration in economic data and earnings growth have been the unsung heroes of the 2017 rally.
And, as long as both of these factors continue to trend higher, that will underpin a continued rise in U.S. stocks, regardless of noise from Washington, North Korea, Russia, etc.
Chart 3: S&P 500
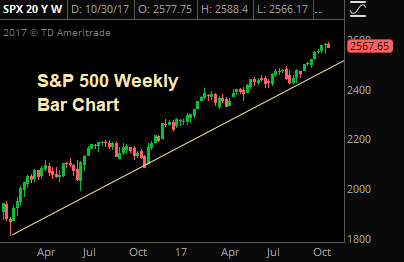
The Trend Is Your Friend
The trend in stocks has been relentlessly higher since early in 2016, and the S&P 500 has held that trend line through multiple tests.
Bottom line, the technical outlook on this market remains powerfully positive.
Chart 4: Commodities (Oil & Copper)
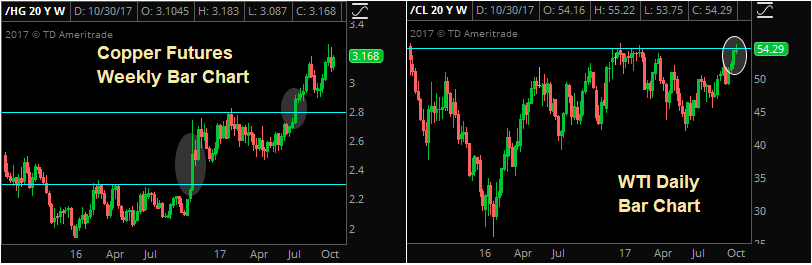
There are few better indicators of global economic growth than industrial commodities, and two or the most important (oil and copper) have been telling us for months that global growth is accelerating.
And, as long as oil and copper are grinding to new highs, that will be a tailwind not just on U.S. stocks, but on global stocks as well.
Group 2: Risks to This Rally
While the four charts above explain why stocks have rallied and why the outlook remains, broadly, positive, there are still risks to this rally and this market.
Don’t be fooled into being complacent with risk management, because while trends in U.S. and economic growth, earnings and the stock market are all still higher, there are warning signs looming on the horizon.
Chart 5: Inflation (Warning Sign #1)
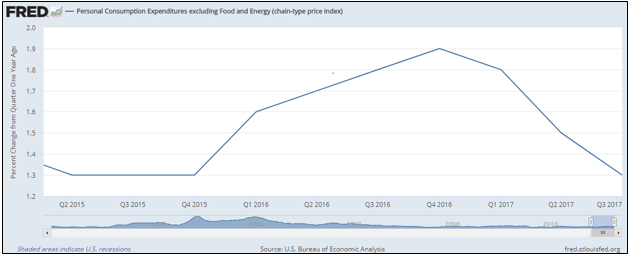
Non-Confirmation: Why Isn’t Inflation Rising?
Inflation remains inexplicably low, considering that we’re near full employment and global economic growth is accelerating.
And, accelerating inflation remains the missing piece of a true “Reflation Rally” that can carry stocks 10%, 15% or even 20% higher over the coming quarters and years.
But, it’s not just about missed opportunity.
The lack of inflation is a big “non-confirmation” signal on this whole 2017 rally, and if we do not see inflation start to rise, and soon, that will be a major warning sign for stocks, because…
Chart 6: The Yield Curve – Will It Invert?
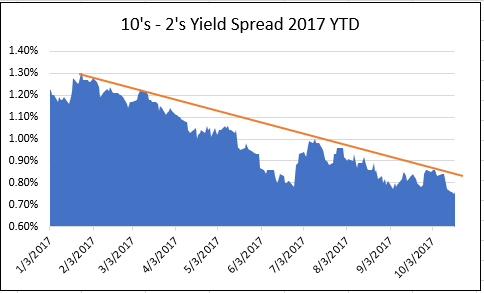
Yield Curve: Sending a Warning Signal?
If the outlook for stocks is so positive, then why did the yield curve (represented here by the 10’s – 2’s Treasury yield spread) equal 2017 lows on Wednesday?
Simply put, if we’re seeing accelerating economic growth, rising earnings, potential tax cuts and all these other positive market events, the yield curve should be steepening, not flattening.
So, if this 10’s – 2’s spread continues to decline, and turns negative (inverts) then that will be a sign that investors need to begin to exit the stock market, because a serious recession is looming, and the Fed won’t have much ammunition to fight it.
If I was stuck on a desert island (with an internet connection and access to my trading accounts of course) and could only have one indicator to watch to tell me when to reduce exposure in the markets, this 10’s – 2’s spread would be it – and it’s not sending positive signals for 2018!
The Sevens Report is the daily market cheat sheet our subscribers use to keep up on markets, leading indicators, seize opportunities, avoid risks and get more assets. Get a free two-week trial with no obligation, just tell us where to send it.
Reflation Update Part 2—Why This Reflation Is Different
In Wednesday’s Report, we covered why the reflation trade that started again in early September has taken a pause, and the reasons are twofold.
First, the market is unclear about who the next Fed chair will be. If it’s Kevin Warsh, that will be a “hawkish” surprise and rates could rise too quickly to keep this reflation “virtuous.”
Second, it’s unclear if upcoming central bank meetings, which means primarily the ECB but secondarily the Bank of England, will be Goldilocks. If either bank is more hawkish than the market expects it could send global rates sharply higher, causing a
pullback in the broad market.
Conversely, if either bank expresses doubts about growth or inflation, it could undercut the whole reflation idea that’s propelled stocks higher.
Point being, there are some key events that need to be resolved before the reflation trade can move higher. And, frankly, that makes this 2017 version of the reflation trade unique compared to previous economic reflations, most recently from ‘03-’06.
For simplicity, the easiest analogy to describe a normal reflation trade is a beach ball. When a recession occurs, the beach ball (the economy) deflates. But, low interest rates and government stimulus act as an air pump, and eventually the beach ball (economy) reflates.
Accelerating economic growth and rising inflation (due to easy money) are the “air” that inflates our economic beach ball. From a market standpoint, economic reflations are usually wonderful things. Markets go up in concert, and the way to outperform is to add beta and be exposed to cyclical, growth-oriented sectors. During a normal reflation (the last one was in ’03-’06) everything goes up regardless of what else is going on in the world.
However, this reflation is different.
Eight years after the end of the financial crisis, our economic beach ball is only half full. That’s because we’ve pumped in the “air” of accelerating economic growth (GDP going from negative to 2.5%ish) but we haven’t pumped any “air” of inflation in, yet.
Despite that, stocks are at all-time highs. Valuations are as stretched as any of us have seen them in decades. And, now we’re very late in the typical economic cycle.
Given that, barring some big surprise on tax cuts or infrastructure spending, it’s unlikely that we’re going to see a material acceleration of economic growth. In reality, 3.5% – 4% GDP growth is quasi impossible given demographics in this country—specifically the large demographic of baby boomers entering retirement, and them being replaced by a smaller workforce.
Getting back to our beach ball analogy, if inflation finally accelerates there will be a shorter time of euphoria—as the other half of our beach ball inflates. We got a hint of that in September.
But given valuations, stock prices and economic growth all are at or nearing reasonable ceilings, the risk is that after a short bit, the “air” from rising inflation over inflates our economic beach ball, and a bubble (or multiple bubbles) develop and we burst the ball. Practically, what I’m talking about is the Fed hiking rates and inverting the yield curve, which would be our signal that the beginning of the end of this eight-year expansion is now upon us.
From an advisor or investor standpoint, this creates a difficult set up. For now, we must continue to be invested and, potentially, allocate to the reflation sectors. Yet we also must do so knowing that unlike most revelations, we’re not going to enjoy an easy rally that lasts years.
So, the now years-long game of market musical chairs continues, albeit with a potentially reflation accelerating the pace of the music. For shorter or more tactical investors, holding “Reflation Basket” allocations makes sense as we approach and navigate these upcoming events.
For longer-term investors, we continue to await confirmation from the 10-year yield that this reflation truly is upon us. A few closes above the 2.40% level will be the signal, in our opinion, to rotate out of defensive names and into part or all of our Reflation Basket—Banks (KRE/KBE/EUFN), industrials (XLI), small caps (IWM) and inverse bond funds (TBT/TBF).
Bottom line, at this point in the economic cycle, for stocks to move materially higher we need inflation to accelerate and cause that reflation trade, but weneed to realize that brings us one step closer to the ultimate “bursting” of the recovery. This market remains more dangerous over the medium/longer term than the low VIX would imply.
Cut through the noise and understand what’s truly driving markets, as this new political and economic reality evolves. The Sevens Report is the daily market cheat sheet our subscribers use to keep up on markets, seize opportunities, avoid risks and get more assets. Sign up for your free two-week trial today and see the difference 7 minutes can make.