How Far Could Stocks Go?
Stocks have screamed to all-time highs in recent weeks, and with new highs always comes the question of how far could stocks go? We like to regularly offer fundamental valuation updates as we did two weeks ago, but it is also important to outline what the charts are telling us as far as upside targets and key support levels for near-term price movements.
This stock market technical update is an excerpt from our March 1st Sevens Report. Claim your free 2-week trial today and cut through the jargon to specifics to support your client conversations.
In the wake of the election there were a lot of very important technical developments. The two most notable were the shift from a bear market signal to a bull market signal in Dow Theory when the S&P was trading at 2165, and confirmation of that signal when the S&P broke to all-time highs November 21.
Currently, both the technical trend and upside momentum of the market continue to suggest the path of least resistance is higher for the medium term. That is the case in spite of the fact that there are countless fundamental uncertainties, most important are related to politics and fiscal policy.
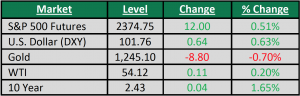
Prices taken at market close on Feb 28.
In a situation like this, where technicals are largely divergent from fundamentals, many financial professionals and investors look for some direction as to how far stocks could rally from current levels and where a pullback would most likely pause if not reverse. So, we put together a few upside targets as well as downside support levels to watch for the S&P 500.
In a quick review, when any issue (stock, bond, commodity or currency) is trading in never-before-seen territory, there are only two ways to come up with targets in the direction of the new highs—measured moves, and likely areas of interest for options traders. The latter is relatively easy to figure out, as options volumes generally cluster around the big round numbers (in this case 2350 and 2400).
Tracking Measured Moves.
Measured moves, on the other hand, are a little more scientific. The idea behind a measured move is that if the market moved a certain distance against the dominant trend, it will more than likely move at least that far back in favor of the trend once it resumes.
- Our next upside target is actually a combination of two measured moves and a likely area of interest for S&P option traders: 2450. On the daily chart, a measured move can be calculated from the late-October lows (2084) to the late-December digestion area (2271), which results in a measured move to 2458 in the S&P from current levels. In a supporting fashion, a measured move on the weekly chart can be calculated from the previous S&P highs of 2126 to the February ’16 lows of 1810. That results in a target of 2442.
- This gives us an ultimate target window of 2442-2458, which encompasses a likely options trader target of 2450.
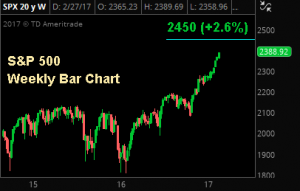
- Bottom line, we are not suggesting that this bull market will end in the mid 2400s; however, for those looking to take profits, you likely will not be alone in doing so in that window around the 2450.
Support Levels
Turning to support levels, the February melt-up in stocks has left a large “volume gap” on the chart, which basically means stocks sprinted from around 2300 to 2360. Because of the velocity of that move higher, there were not many logical support levels created in the month of February. And a set up like that raises the odds that there could be a swift move back through that area.
- There is an initial and minor area of support around 2343, where there was minor consolidation on February 16. This area will at least be noticed by technical traders and volume-driven algorithms.
Secondary and more formidable support lies near the previous set of new all-time highs established in December in the band between 2270 and 2280. Here there will be buyer support from both bulls who missed out on the breakout as well as faster-money short sellers looking to book profits.
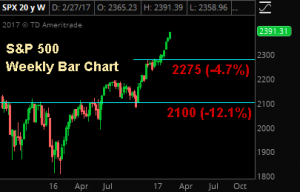
- Our final support zone is derived from a weekly timeframe, and again at a previous all-time high of 2100, where the most consolidation occurred since the tech sell-off finally ended in 2002.
These levels are meant to provide you with a general idea of the most important technical levels on either side of the broader stock market right now. This information, we have heard in the past from advisor subscribers, is very useful in conversations with clients.
Join hundreds of advisors from huge brokerage firms like Morgan Stanley, Merrill Lynch, Wells Fargo Advisors, Raymond James and more… see if the Sevens Report is right for you with a free 2 week trial.