Archive for month: October, 2014
What You Need to Know About the Deflation Threat
What You Need to Know About the “Deflation” Threat
We are on the eve of another CPI report. As we look back over the last month, the surprise steep decline in the September CPI release was one of the catalysts that turned this market lower, as focus shifted squarely to dis-inflation and the stronger dollar.
But, it’s important to point out that what we have seen over the past two months in the U.S. was a commodity-led decline in inflation statistics … not full-scale deflation. For those of us who were in the business in 2008, we’ve seen what real deflation looks like (at least as close we ever want to get to it). Major indicators of monetary conditions, credit, economic activity, consumer spending, etc. are NOT showing dis-inflation. CPI is showing dis-inflation, mainly because of commodity prices.
Much has been made of the decline in the 5-year inflation break-evens (the difference in 5-year TIPS yields and 5-year Treasuries). Yes, it is true they have declined sharply. But, keep in mind TIPS are priced off of headline CPI – so as headline CPI drops (with oil and other commodity prices), then the attractiveness of TIPS also drops. Again, that’s because it is directly tied to headline CPI. Case in point, if you look at a chart of DBC (the commodity ETF), you’ll see it closely mirrors the drop in 5-year inflation expectations, and that’s not just a coincidence.
Two very reliable indicators of deflation (which I learned to follow during the ’08 crisis) are the adjusted monetary base and revolving consumer credit.
Adjusted monetary base is one of the most useful barometers of the stock of available money in the U.S. It’s accelerated to a new all-time high and is considerably higher than it was just a year ago, thanks to QE.
Revolving consumer credit (think credit card debt and other consumer-based lending) has exploded so far this year.
So, while things may change in the future, obviously, neither of these indicators are signaling we are seeing any sort of a deeper deflation threat.
PMIs are at multi-year highs. The six-month rolling average of payrolls is at multi-year highs. Durable goods, retail sales, housing prices, etc. are all fine. Weekly jobless claims hit an 14-year low last week.
Nothing in the economy that I can see is screaming dis-inflation, other than CPI and (potentially) the yield curve, which has flattened. But, I believe what’s going on in the bond market is a confluence of the short end selling off in anticipation of the Fed Funds hike next year (so short term rates go up), and the long end rallying as European money flows into Treasuries given their relative value (so long rates decline, flattening the yield curve). If we see a global deflation/depression, then obviously the U.S. won’t be immune, but my point here is to show the difference between real deflation, and commodity price-led dis-inflation.
Bottom line, there is a silver lining to this commodity-led dis-inflation, as it’s a positive for the U.S. consumer. And, over the next few days, we’re going to be laying out a case as to why we think a theme for the remainder of the year is the “return of the U.S. consumer” and why consumer-related stocks (finance companies and select retailers) can outperform if the broader market stabilizes.
To continue reading today’s edition of the Sevens Report simply fill out the form on the right hand side of this page.
Weekly Economic Cheat Sheet
Last Week
We got a lot of data and central bank speak last week, but not a lot changed from a macro standpoint—except we were reminded that the U.S. economic rebound remains very much intact, despite mixed data. And, that was an incremental positive late in the week.
Despite that strong finish, things were ugly to start last week. Retail sales slightly missed expectations, falling -0.3% vs. (E) -0.1%. The “control” group, which is retail sales less autos, gasoline and building materials, met expectations, declining -0.2%. But the previous month was revised lower, from a +0.4% gain to just a +0.2% gain.
Also early last week Empire State manufacturing, which is the first data point from October, plunged, dropping 6.17 vs. (E) 20.50. New orders, the leading indicator in the report, went negative for the first time in months.
And, despite retail sales being just a small miss and Empire State being historically volatile and not very correlated to national manufacturing activity—in a market that was nervous about growth everywhere—these disappointing reports definitely contributed to the stock market declines, as people (inappropriately) began to get nervous about U.S. growth.
But, the data late in the week helped calm some nerves. Industrial production beat expectations (up +1% vs. (E) +0.4%), the manufacturing subcomponent (which is the important part of the release) was a slight beat, and Philly Fed stayed strong (20.7 vs. (E) 20.0) and importantly contradicted and potentially invalidated the bad Empire State report. Finally, weekly jobless claims plunged to a 14-year low, which helped sentiment.
Again, bottom line was the data were mixed and the negative market reaction to the early-week “misses” was more a reflection of overall nervousness—not that the data were that “bad.“
Looking at the Fed, there was a lot made about “dovish” comments by Bullard and Williams (especially the Bullard comments).
But, neither one reflects the “core” of the FOMC. Although Fed Funds futures continue to push out the expected date of the first rate hike (now December 2015), the Fed will almost certainly end QE at the meeting next week.
This Week
This week is all about the October global flash PMIs, plain and simple. Chinese numbers come Wednesday night, while European and U.S. numbers come Thursday morning. Given that worry about global growth is the main negative influence on markets right now, these numbers are the next major catalysts for markets.
In China, the main focus is whether the flash PMIs can hold 50 (if they can, it’ll be a mild positive). In Europe, it’s the same question (can they hold 50?). Sentiment is so negative toward Europe right now, it’ll take a pretty bad number to make the outlook there materially worse. Finally in the U.S., the market will be looking for further evidence that, despite global issues and a stronger dollar, the manufacturing sector is continuing to expand at a decent pace.
After the flash PMIs, the next most important number to watch is the September CPI, out Wednesday. As you know, growth and dis-inflation are the two concerns in the market right now. Obviously the PMIs give us a glimpse into growth, and the CPI will give us a glimpse into the dis-inflation. A bounce back toward that 2.0% yoy increase in core CPI will be very welcomed by the market, if it occurs.
Third in importance this week are the Chinese economic data coming tonight: GDP, IP and Retail Sales. China’s been put slightly to the back burner with all this Europe worry, but growth there needs to maintain pace. If concern grows that China may not be able to maintain 7.0% annual GDP growth, this will be an added negative on the market.
To continue reading today’s Sevens Report, simply sign up for a Free Trial on the right hand side of this page.
Greek Bond Yields Surge
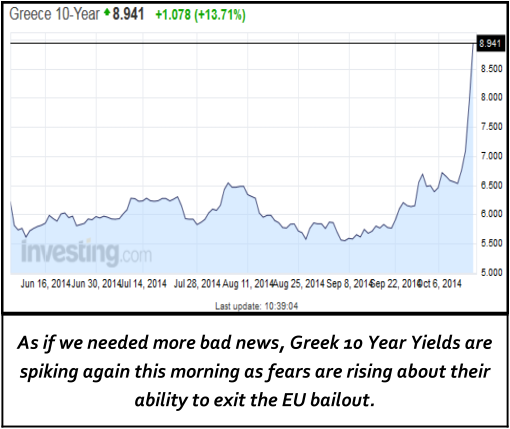
Sign up for a Free Two Week Trial on the right hand side of this page to read our analysis of the current turmoil in Europe.