Is Dis-Inflation a Worry?

Is Dis-Inflation a Worry?

Since the surprisingly weak CPI report earlier in September, there’s been a subtle but growing concern about the return of dis-inflation—not in the EU, but in the U.S.  And, recently we’ve seen a fair bit of financial media coverage detailing the fall in market inflation expectations—so I wanted to cover the topic and explain why we’re seeing that dip (it’s not entirely because the market is expecting dis-inflation).

Renewed worries about dis-inflation have come from three places:

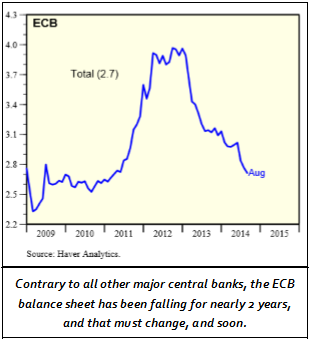
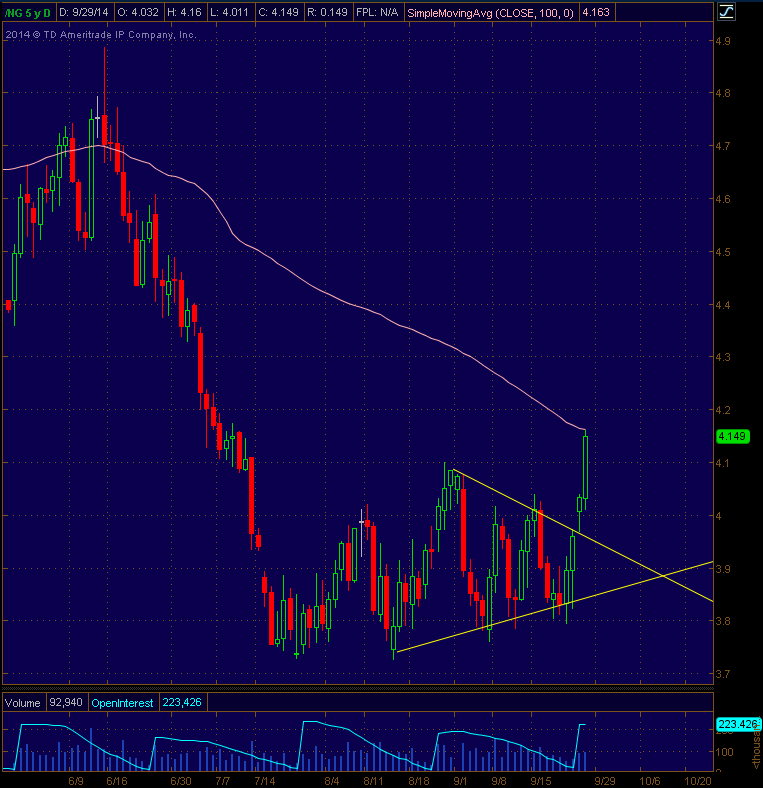
First, commodity prices have utterly collapsed since earlier this summer, which obviously weighs on inflation statistics.

Second, despite the stock market reacting “dovishly” to the last Fed meeting, bonds and the dollar are beginning to price in the reality of a rising Fed Funds rate in mid-2015.  Given the apparent lack of statistical inflation, the reality of a higher Fed Funds rate will dampen expectations for inflation 5 years out.

Third, and most-cited, both the 5- and 10-year Breakeven Inflation Rate have dropped precipitously over the past three months. (The breakeven inflation rate is the difference between the yield on a Treasury bill vs. the yield on the same-duration TIP.  So, the 5 year-inflation break-even is the yield on the 5-year Treasury minus the yield on the 5-year TIP.)

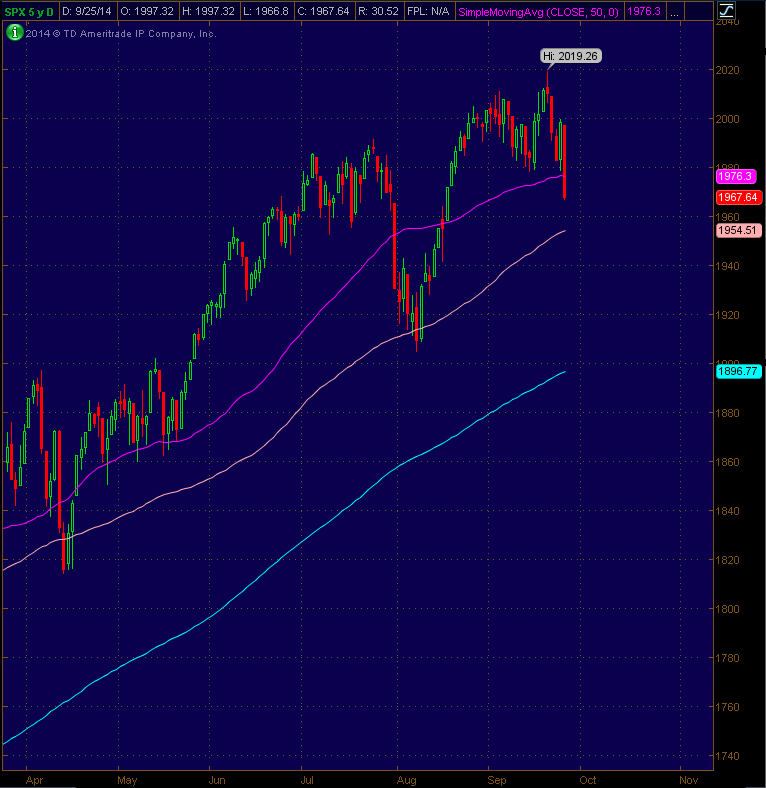
These events have led some to become worried that the U.S. is about to go through another period of “dis-inflation.” If that does indeed happen, then stock  prices will get hit—potentially hard (because the Fed is basically out of monetary bullets).  It’s also led some to believe the Fed may end up being slightly more “dovish” than is currently expected.

But, yesterday we got some encouraging news on inflation.  The August “Core PCE Price Index,”  which is the Fed’s preferred measure of inflation, was unchanged from July, at a +1.5% increase year-over-year.  Importantly, it didn’t confirm the drop we saw in CPI in August, and should help to alleviate some concerns about dis-inflation (this was underappreciated by the market yesterday).

Turning then to the “inflation breakeven,” with regard to the drop in the 5-year inflation breakeven, that number is very highly correlated to commodity prices. If you’ll look at a chart of the 5-year breakeven yield (link here), it started to decline very shortly after commodity prices began to collapse in late June.  So, it would appear most of that has to do with commodity price declines (so it’s mostly a commodity phenomenon, not something more structural and worrisome).

The 10-year breakeven is a bit more worrisome, but if you look at that chart, what you’ll see is it really came for sale hard following the lackluster jobs report of August. What I think the 10-year is reflecting is the lack of wage inflation, as represented by the poor August jobs report.  Remember, wage inflation begets real inflation, so until we start to see material wage inflation (which will come from further labor market improvement), expect the 10-year inflation expectations to remain relatively subdued.

Bottom line, dis-inflation is a background risk we need to monitor here in the U.S.—but at this point the low inflation readings seem to be more a product of commodity price declines and sluggish wage inflation … not an indicator that the market’s fundamental outlook on inflation going forward has materially changed.

This was an excerpt from a recent edition of the Sevens Report, the only daily publication that provides you with everything you need to know about the markets, by 7:00 AM each morning, in 7 minutes or less. To try the Sevens Report free for two weeks, simply sign up on the right hand side of this page.

What the ECB Balance Sheet Means for Stocks and Bonds

The Key to Europe—the ECB Balance Sheet (What It Means for Stocks and Bonds)

ECB 9.30.14

What Happened:  Part of the reason we’ve seen a rally over the past two days in the Treasury market is because of Europe—specifically the “dud” of the first TLTROs late last week.

Not only was demand for the initial offering poor (86.4 billion vs. (E) 150 billion euros), but on Friday European banks actually repaid nearly 19 billion euros worth of the previous LTRO, making the total addition to the ECB balance sheet only about 67 billion (86.4B – 19B)—less than half of the 150 billion the market expected.

Why It’s Important:  The size of the ECB balance sheet is very critical to the economic recovery in Europe.  QE, TLTROs, ABS purchases and all the other acronyms are simply tools being deployed to accomplish the same goal—to get the ECB balance sheet to rise.

The logic goes that if the ECB can expand its balance sheet and pump money into the system, then they should create economic growth. That would in turn create inflation, which would then solve the deflation problem they are currently experiencing.  (That script has “worked” in the US, UK and lately, Japan).

So, to keep things simple, an expanding balance sheet is inflationary and positive for growth, while a contracting balance sheet is deflationary. And as you can see from the chart, the ECB is the only major central bank whose balance sheet has been contracting.

How We Make Money Off It: If the ECB fails to materially expand its balance sheet, then deflation will get a tighter grip on the economy. European bonds will rally like they did for most of this year, and that will put upward pressure on Treasuries—just like it did from March to September.

As the ECB implements these measures (TLTRO, ABS), you will see the market waver in the short term between thinking the measures are working (and the balance sheet expanding, which is Treasury-bearish) and the measures failing (as in the case of last week, which is Treasury-bullish).

Treasuries will be much more sensitive to the short-term data from Europe than stocks.  But importantly, as long as the ECB remains committed to expanding the balance sheet, any short-term rally is “noise” compared to the overall negative trend in bonds.

European stocks should be much less sensitive to short-term fluctuations than bonds.  That’s because, as was the case last week, the failure of the initial TLTRO was just seen as further increasing the odds of QE. The ECB simply cannot fail to increase its balance sheet and spur a recovery—because if they do, it’s very likely the EU would split apart. (Southern European countries are not going to stay in the EU if deflation takes hold—they will break away and devalue their own currencies.)

So, bottom line is this:

“Short bond positions” will see volatility depending on what’s happening with the ECB balance sheet, because it will directly affect Treasuries.  But, the trend should remain lower in bonds as long as the ECB remains committed to balance sheet expansion. So, don’t get spooked by counter-trend rallies.

For “long Europe” equity positions, the trend upward should be more smooth, as stocks are clearly viewing “bad as good” in Europe—as long as the expectation remains that the ECB will eventually do QE.  Point being, the trends (Treasuries down, European stocks up) remains in place despite the fact we’re likely to see some short term counter trend moves.

To learn more, sign up for a two week free trial on the right hand side of this page.

Sevens Report 9.30.14

Sevens Report 9.30.14LDE

Natural Gas Climbs to 10 Week High

NG 9.29.14

Natural gas futures broke out above resistance on Friday and extended gains today, trading up to a 10 week high before meeting resistance at the 100 day moving average.

To learn more about what is next in the natural gas market, simply sign up for a free trial on the right hand side of this page.

Your Weekly Economic Cheat Sheet

Last Week

The calendar was busy, but the only numbers of any real importance last week were the flash global manufacturing PMIs. There were gives and takes, as always, but the bottom line was that they met current market expectations (and as such aren’t rocking the global macro boat).

Growth remained strong in the U.S. While it was a “technical miss” vs. expectations (57.9 vs. (E) 58.1), the September flash PMI was the second-highest ever. So on an absolute basis, it’s still strong.

In Europe, official EMU PMI stayed above 50 (so technically in expansion territory). But, the German number was a big miss (50.3 vs. (E) 51.2), and that number was definitely the biggest disappointment last week.

But, if Germany was the disappointment, then China was the positive surprise. Despite loud “whispers” that PMI would drop below 50, it actually rose slightly. It confirmed what we know about China: Growth isn’t particularly strong, but it’s not about to implode either.

The takeaway from last week was: The U.S. is still strong, China is “OK” and Europe remains in the economic ICU.

This Week

It’s a busy week of data with a large number of reports. While we get insight into virtually every corner of the domestic and global economy this week, the most important numbers to watch will be from Europe.

In order of importance: EMU flash HICP (their CPI) (Tuesday), U.S. jobs report (Friday), ECB decision and press conference (Thursday), global official PMIs (Tuesday night/Wednesday morning), global composite PMIs (Thursday night/Friday morning).

The EMU HICP is the most important number of the week because it’ll offer us the latest insight into whether we are seeing a continued slight moderation of deflation fears in the EU.  Because a “triple-dip” recession in the EU remains the #1 global macro risk to watch, it’s obvious why this inflation reading is so important.

The jobs report here in the U.S. is always important, although honestly it’s not quite as monumental as it has been in the past. Unless it’s another “dud” like August, or a very hot number (say north of 300K) it’s not going to shift expectations for the Fed.  But, it will be important to see a bounce-back and a revision higher to August’s disappointing 142K.  Also keep in mind it’s “jobs week,” so we get ADP Wednesday and claims Thursday.

The ECB meeting Wednesday won’t bring any new policies or interest rate cuts, but the market will be looking for more reassurance from Draghi & Co. about both their willingness to do QE if needed (and it almost certainly will be), and their reaction to the soft TLTRO demand. (If he can make a credible case why he thinks the December offering will be good, that will help market sentiment and be EU-stock-positive, bond-negative.)

The official PMIs are released Tuesday night/Wednesday night, and China’s official government manufacturing PMI will be the most important number to watch. It’s holding on above 50 and if it can confirm the surprise uptick we saw in the Markit flash PMI last week, it’ll help alleviate some nerves about the pace of China’s economic growth. The European and U.S. numbers will obviously be closely watched, but they shouldn’t differ too far from the “flash” readings we got last week. (If there’s a surprise negative revision to the European data, it may weigh on markets a bit, but there are too many other catalysts this week for it to do any major damage.)

Finally, we get the composite global PMIs (so, manufacturing and service sector) Thursday and Friday, and again the market will be looking for confirmation of current expectations:  Chinese economy losing some momentum but still seeing incremental growth, Europe “hanging on,” and the U.S. recovery progressing.  As long as the numbers generally confirm those expectations, don’t expect too much of a market reaction.

But, proving my point it’s a busy week, we also get several other numbers: Personal Income and Outlays will be watched this morning to see if there is a drop in the “core PCE price index” (the Fed’s preferred inflation gauge). Remember, CPI two weeks ago surprisingly dropped. If core PCE confirms this, it may give the Fed some room to stay “dovish” a bit longer than the market may expect. So, there is risk from a Fed expectation standpoint into the number.  We also get more housing data, via Pending Home Sales Tuesday, auto sales Wednesday, and non-manufacturing PMIs Friday.

Japan also has a slew of data out overnight tonight, but the biggest number this week will be the Tankan survey, released tomorrow night.  Worries about a slowing Japanese economy and eventual incremental stimulus have pushed the yen to multi-year lows and the DXJ to near-all-time highs. So, the data need to confirm that we are indeed seeing a slowdown; otherwise we could see a violent (albeit temporary) snapback move in both the yen and DXJ.

Bottom line is this week is busy, but really the key is Europe.  If investors can come away from this week more confident about Europe and the ECB, it’ll become a welcomed tailwind on risk assets (and likely a headwind on Treasuries).


Sevens Report 9.29.14

Sevens Report 9.29.14AFU

Need to Know on China

Need to Know on China

China has been in the news the last two days, specifically a WSJ article speculating that the head of the PBOC will be replaced in October. This was the main headline cited for both Wednesday’s move higher, and yesterday’s breakdown.

Before getting into the market reaction, though, basically what the article said was Chinese leadership was considering replacing the current head of the PBOC, Mr. Zhou Xiaochuan.

Zhou is seen as a reformist—meaning he is intent on imposing structural reforms on the Chinese economy (which are needed and longer-term positive).  But, those changes, as we’ve seen, also dampen economic growth.

So, his potential removal was seen by the market as a sign that Chinese authorities may be focusing more on stimulating short-term economic growth, and U.S. stocks rose on the news Wednesday.

But, Chinese stocks didn’t—they ignored the news (implying U.S. markets overreacted) and this was part of what turned futures negative Thursday morning (the unwind of the Wednesday rally).

Bottom line with China is this:  7% GDP growth is the Maginot Line.  Fears are rising that the Chinese government will reduce its 2015 GDP growth target from 7.5% to 7.0%, and that may well happen in October. But if growth is forecast sub-7%, that will re-ignite worries about a “Chinese hard landing,” which will be a new macro headwind on stocks.  So, despite all the “noise,” the number to watch is 7% — above that and China will not be a major negative on equity prices.


Sevens Report 9.26.14

Sevens Report 9.26.14WSF

Stocks Crash Through Support

SPX 9.25.14

The S&P 500 is now down 2.5% from last week’s fresh all time highs, trading well below support at both the recent 1980 level as well as the 50 day moving average (1976).

It’s Not Just About Europe and the Long Bond

It’s Not Just About Europe and the Long Bond

We focus predominantly on the long end of the curve here because that’s where I see the biggest money-making opportunity given the ETFs we have access to.  But, watching the entire yield curve is important in gauging the overall trend of bonds.

To that end, I want to point out that the yield on the 2– year Treasury, which is most sensitive to Fed Funds rate expectations, rose 5 basis points to 0.59% (5 basis points is nearly 10% and the yield on the 2-year is at a multi-year high).  This is important because while Europe is a major influence on the long bond, there appears to be something else going on here (European buyers wouldn’t buy the 2-year in a “reach for yield”).

As I’ve said, the short end of the curve is much more sensitive to Fed Funds expectations. So, the fact that the 2-year bond has declined/yields risen to multi-year levels is significant. It implies the bond market is preparing for a more “hawkish” Fed – at least compared to what we’re seeing in the equity market.  Simply, the 2-year yield wouldn’t be at multi-year highs if the market wasn’t starting to price in the possibility of sooner than expected Fed Funds “lift off” (the date rates start to rise), or a faster than expected rise in rates. That, on the margin, further validates my idea the trend in bonds is now lower, and that’s positive for our various “higher rate” positions.