S&P 500 Chart
Stocks spent virtually all of Thursday near unchanged in quiet holiday-like trade, as markets ignored economic data and geopolitical news (Russian sanctions). The S&P 500 dipped a slight 0.03%.
The S&P 500 pulled back for a second day yesterday but importantly held our initial support level at 2246 mentioned on pg. 5 of the Sevens Report.
As was to be expected, trading was very quiet yesterday as the S&P 500 moved in just a 10-point range peak to trough. There were multiple economic reports out yesterday morning and they were mixed, but markets aren’t worried about economic data this week, and stocks opened slightly higher initially on a bounce back from Wednesday’s weakness. That initial rally lasted only 60 minutes, and shortly after 10:30 a.m. stocks were negative once again. View the S&P Chart below.
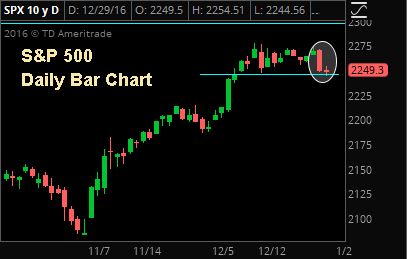
S&P Chart
There was no real catalyst for the selling, and instead it was just a continuation of the profit taking we saw on Wednesday. Stocks continued to drift lower in quiet trade trough lunch time, and the S&P 500 did make fresh two-week intraday lows.
Unlike Wednesday, the selling dissipated below 2245 and stocks traded sideways for the remainder of the afternoon.
News of the Russian sanctions was the only notable headline in the afternoon, but those were more targeted at individuals and won’t have any real economic implications, so the markets largely ignored them. As mentioned, given the looming administration change, we don’t see poor Russian/US relations as a major macro influence in 2017 as they will likely improve in early Q1 ‘17. Stocks closed quietly with slight losses.
Trading Color
On Thursday, there was clear profit taking in the “out of safety/into cyclicals” trade that’s outperformed since the election, as cyclical sectors badly underperformed safety and higher-yielding sectors.
Of the nine SPDRs we track only three were down yesterday: Financials/XLF (-0.75%), energy/XLE (-0.37%), and consumer discretionary/XLY (-0.13%). Banks also were down more than 1%.
Conversely, of the six SPDRS that were up, utilities/XLU outperformed, rising 1.4% while consumer staples/XLP rose 0.5%. Most of the other sectors were little changed.
Given the sector laggards yesterday were the best performers since the election, and the outperformers were the sectors that have fared the worst since the election, it’s not hard to determine we’re seeing some profit taking in that trade.
Given how elevated expectations are for growth in early 2017, continuation of a short-term reversal in the out of safety/into cyclicals trade may well continue in early 2017, although longer term the outlook for bond proxy sectors like utilities and REITs is still challenging. Meanwhile, the outlook for cyclicals/value stocks is more attractive. Point being, the longer-term trend is still towards cyclical outperformance over income-oriented sectors like utilities and REITs.
Finally, continuing the week-long trend, gold and gold stocks surged yesterday with GDX rallying more than 6% mostly on short covering, but also on gold strength. If we see a short-term pullback in the dollar to start 2017, gold and gold stocks will benefit the most and may be of interest for those with a trading bent.