S&P 500 Chart

Stocks spent virtually all of Thursday near unchanged in quiet holiday-like trade, as markets ignored economic data and geopolitical news (Russian sanctions). The S&P 500 dipped a slight 0.03%.

The S&P 500 pulled back for a second day yesterday but importantly held our initial support level at 2246 mentioned on pg. 5 of the Sevens Report.

As was to be expected, trading was very quiet yesterday as the S&P 500 moved in just a 10-point range peak to trough. There were multiple economic reports out yesterday morning and they were mixed, but markets aren’t worried about economic data this week, and stocks opened slightly higher initially on a bounce back from Wednesday’s weakness. That initial rally lasted only 60 minutes, and shortly after 10:30 a.m. stocks were negative once again.  View the S&P Chart below.

s&p-500-chart

S&P Chart

There was no real catalyst for the selling, and instead it was just a continuation of the profit taking we saw on Wednesday. Stocks continued to drift lower in quiet trade trough lunch time, and the S&P 500 did make fresh two-week intraday lows.

Unlike Wednesday, the selling dissipated below 2245 and stocks traded sideways for the remainder of the afternoon.

News of the Russian sanctions was the only notable headline in the afternoon, but those were more targeted at individuals and won’t have any real economic implications, so the markets largely ignored them.  As mentioned, given the looming administration change, we don’t see poor Russian/US relations as a major macro influence in 2017 as they will likely improve in early Q1 ‘17.  Stocks closed quietly with slight losses.

Trading Color

On Thursday, there was clear profit taking in the “out of safety/into cyclicals” trade that’s outperformed since the election, as cyclical sectors badly underperformed safety and higher-yielding sectors.

Of the nine SPDRs we track only three were down yesterday: Financials/XLF (-0.75%), energy/XLE (-0.37%), and consumer discretionary/XLY (-0.13%). Banks also were down more than 1%.

Conversely, of the six SPDRS that were up, utilities/XLU outperformed, rising 1.4% while consumer staples/XLP rose 0.5%.  Most of the other sectors were little changed.

Given the sector laggards yesterday were the best performers since the election, and the outperformers were the sectors that have fared the worst since the election, it’s not hard to determine we’re seeing some profit taking in that trade.

Given how elevated expectations are for growth in early 2017, continuation of a short-term reversal in the out of safety/into cyclicals trade may well continue in early 2017, although longer term the outlook for bond proxy sectors like utilities and REITs is still challenging. Meanwhile, the outlook for cyclicals/value stocks is more attractive. Point being, the longer-term trend is still towards cyclical outperformance over income-oriented sectors like utilities and REITs.

Finally, continuing the week-long trend, gold and gold stocks surged yesterday with GDX rallying more than 6% mostly on short covering, but also on gold strength. If we see a short-term pullback in the dollar to start 2017, gold and gold stocks will benefit the most and may be of interest for those with a trading bent.


Chart of the Day: Natural Gas Continues to Climb

ng-12-28-16

Natural gas futures continued to climb yesterday as weather reports are forecasting colder than average temperatures well into 2017 which is raising prospects for more larger than average supply draws.


Stock Market Update: 12/28/16

stock market update

Here is an excerpt Stock Market Update from The Sevens Report.  Stocks rallied in quiet trade to start the final week of the year yesterday, as the Nasdaq reached a new all-time high. The S&P 500 gained 0.22% on the day.

Futures were flat early yesterday, but once the bell rang stocks jumped higher out of the gate thanks to economic data that showed an increase in home prices and a spike in consumer confidence.

But with attendance so low between Christmas and New Year’s holidays, and as Hanukah continues, the rally failed to gain any traction and the benchmark averages began to slip from early highs into the lunch hour.

News flow remained extremely quiet, volumes were down and attendance was thin, which allowed stocks to continue to bleed lower into the afternoon until they closed basically in the middle of the day’s trading range.

Technically speaking, the Nasdaq composite hit new highs; however, Dow 20,000 remained elusive for another day despite a run to within 20 points of the psychologically significant level.

Trading Color

Yesterday was slow from both a macro and micro standpoint, as both index and sector movements could best be characterized as drifts. The Russell 2000 and Nasdaq both outperformed the S&P 500, but only slightly, up 0.5% to the S&P 500’s 0.22%.

Internally, the rally was broad as all nine SPDRs we track finished higher, although none came close to rising more than 1%. Basic materials and tech were the two outperformers, up 0.5% and 0.45%, respectively. Materials

were up on the general lift in the commodity complex, while tech rose thanks to preliminary indications of strong holiday sales. AMZN in particular rallied more than 1.5% on reports of strong Amazon branded product sales (Alexa in particular). NFLX also was nearly 2% higher on news of strong holiday subscription sales.

More broadly, there was slight cyclical outperformance yesterday as consumer staples and utilities finished basically unchanged on the day while the aforementioned materials and tech sectors outperformed. But again, the moves were minimal and can be chalked up to random trading noise.

Bottom line, Tuesday was a quiet day in the markets, and with a barren calendar looming for the remainder of the week we can expect more of the same going forward.

Bottom Line: 4 Events To Watch in Q1 2017

In Monday’s issue, I pointed out four policy errors that could adversely affect markets in 2017. With that in mind, I wanted to point out specific events and dates that will give us color on those potential policy errors.

To a point, this is a preliminary catalyst list for Q1 2017, although obviously we will be adding to it as the weeks go by. As we start 2017, though, these are four key dates/events to watch.

1) Trump’s Policies – Will They Meet Very Lofty Expectations (Jan. 20)? Don’t be surprised if we see a “Buy the president-elect, sell the president” market reaction in 2017, as investors could book profits once Trump assumes office. That’s because the single biggest question for markets is whether the actual policies put forward by the new government will meet the very lofty market expectations, and there is serious risk of a disappointment.

We’ll be focused on leading indicators that will tell us whether these policies look likely, because if they don’t, stocks could drop sharply after the inauguration.

2) Fed Meeting (Jan. 31). It’s not a coincidence the hawkish December Fed meeting basically arrested the post-election rally. By the time the January Fed meeting occurs, we’ll have a lot more information on inflation and growth, and it’s entirely possible that the Fed signals another rate hike is coming. If that happens, the 10-year Treasury yield could surge to 3%, and that will hit stocks, regardless of what Trump is doing.

3) Semi-Annual Currency Report (March/April). What if Trump starts a trade war with China? I’m not saying it’s going to happen, but the market is so enamored with potential pro-growth policies that it’s largely ignoring the fact that Trump wants to take a hardline stance on trade. Last week, Trump appointed Peter Navarro, author of the book Death by China, to head a new trade council.

If the Treasury Department labels China a currency manipulator in this Currency Report, automatic tariffs are imposed and a trade conflict could easily ensue.

4) Fed Meeting, (March 15). At this point, we’ll know a lot more about the policies coming out of Washington, and if we’re going to see a lot more fiscal stimulus, then Yellen herself has said the Fed will react with higher rates to prevent inflation.

This March Fed meeting is the first of 2017 with an updated “dot plot,” so if the Fed wants to communicate more hikes in 2017, this is the first opportunity to do so. That will send the dollar and bond yields sharply higher, which will be a headwind on stocks.


Chart of the Day: NASDAQ Powers to New Highs

comp-12-27-16

While the 20,000 mark remained elusive in the Dow Jones Industrial Average, the Nasdaq Composite Index rallied to fresh all-time highs yesterday.


Chart of the Day: Nat Gas Surges Ahead of EIA Report

ng-12-21-16

Natural gas surged nearly 10% yesterday thanks to speculation that colder temperatures across the country will boost heating demand and in turn, draw down elevated inventories.


Stock Market Update: 12/21/16

Vorsicht, Kleingedrucktes

Stocks rallied modestly Tuesday, as a mild resumption of the Trump trade carried the major averages close to all-time highs. The S&P 500 rose 0.36%.

Stocks were higher from the outset Tuesday as the BOJ was, on balance, slightly dovish and data from Europe was good (German PPI was hot as was British Distributive Trades).

From a micro-economic standpoint, Jefferies’ earnings were better than expected (a boost to financials). Stocks popped at the open and then, amidst a total dearth of any incremental news, drifted sideways for the remainder of the session.

Mid-morning and mid-afternoon there were two attempts to push stocks down into negative territory, but with no news to disrupt the current positive narrative the selloffs didn’t generate any momentum. Stocks bounced into the close to finish just off their best levels of the day. Overall, it was an extremely quiet and uneventful trading session.

Trading Color

With no bad news to shake the current outlook, the Trump trade was back on in modest form yesterday. Small caps and cyclicals again outperformed, and industrials were also strong (the Dow hit an all-time high, although it failed to break above 20k).

From a sector standpoint, financials led as XLF was the only SPDR we track to close up more than 1%. Banks were also very strong as KRE rose nearly 2%. The Jefferies’ results helped those names rally, but with yields rising again there was already a tailwind there.

Most other sectors were little changed as staples, energy and healthcare closed with very mild losses while basic materials, tech, utilities and industrials all notched small gains.

Consumer discretionary was the only other sector that moved notably as XLY rose 0.80% thanks to some buying in NKE ahead of earnings (which were better than expected). But retail in general is facing an ever-increasing headwind as corporate tax reform begins to take shape .


Can Trump Fire Yellen?

pic_giant_012916_trump-yellen

Can Trump Fire Janet Yellen?

I was asked that question at a Christmas Party on Saturday night by a local real estate agent.

He’s not an active investor (he has an FA) but he does follow the markets, and he was nervous that Trump may fire Yellen because Trump said he thinks interest rates are too low (and rising interest rates are obviously not good for the real estate business).

Before telling my friend that Trump can’t fire Yellen, I asked him if he asked his FA the same question (I try not to directly contradict peoples’ advisors unless they are just outright wrong).

He said he did, but the FA gave this vague answer and dismissed the question. My friend got the distinct idea that the FA didn’t know the answer.

Now, that’s not a knock on the advisor.

In today’s ultra-competitive money management industry, advisors simply don’t have the time to spend doing the research needed to understand the Fed and the implications to all assets.

That’s why we make sure we do the work for them and deliver our daily research note to them at 7 AM every morning and keep it readable in 7 minutes, so they can spend their time on the things they are compensated for:

  • Building client relationships,
  • Increasing AUM, and
  • Closing prospects. 

To that point, I doubt this advisor’s firm provided her the direct explanation as to why the President can’t fire the Fed Chair, and I also doubt her brokerage firm provided much research on the Fed outlook for 2017 (beyond recapping last week’s FOMC Meeting).

But, as our focus turns towards 2017, there is the potential for even more Fed related market volatility as one of the biggest unknowns that has the potential to shake markets and the economy is the relationship between Fed Chair Yellen and President-elect Trump.

For the first time in my memory, we could be looking at a publicly adversarial relationship between the President and the Fed chair, and no one knows what that means for markets.

Since last Wednesday (the FOMC Meeting), we’ve been the Fed “expert” for our paid subscribers, and given them the talking points they need to 1) Explain why the Fed is causing bond yields to surge even higher and 2) Demonstrate they understand what more rate hikes in 2017 means for all client holdings: Stocks, Bonds, Currencies, Commodities.

At parties and events this past weekend, our paid subscribers had the talking points they needed to be able to turn my friend’s question into an opportunity to get a new client!

That’s what we do for paid subscribers every trading day at 7 AM, and it’s why we believe we’re the best value in the independent research space.

It’s important that everyone understands the context of the Trump/Yellen relationship, because that helps to look past the media hype and bluster to accurately assess what the changes in the Yellen/Trump relationship mean for markets. We’ve included an excerpt of that research as a courtesy.
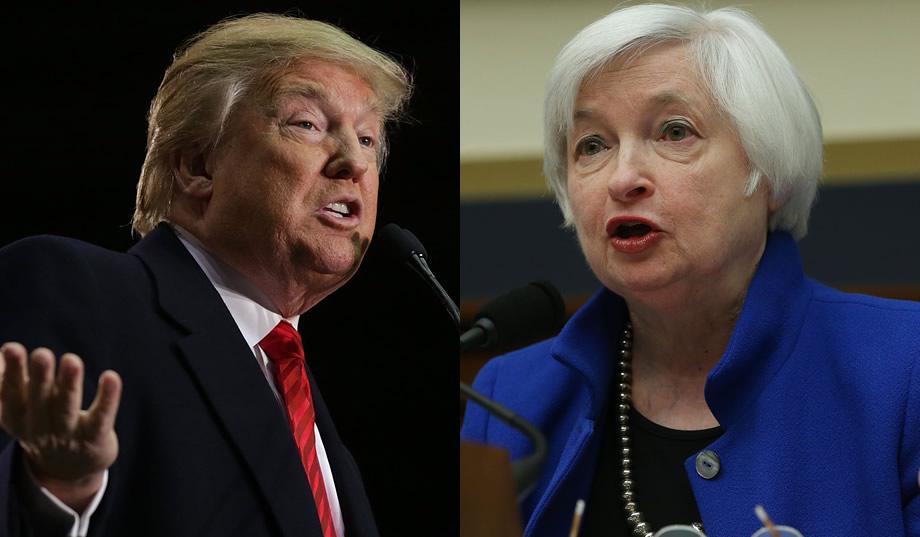
Yellen vs. Trump

Potential differences between the two have been apparent for months, as Trump criticized the Fed on the campaign trail in two specific ways. First, he said the Fed has kept rates too low for too long, and has created multiple bubbles to prop the economy up.

Second, he said the Fed kept rates ultra-low to support the economy and get Clinton elected.

Since he won the election, Trump has stayed quiet on the Fed, although there were a lot of us watching Twitter following Wednesday’s FOMC meeting to see whether Trump would respond to what some interpreted as criticism by Yellen towards Trump/Republican fiscal policy.

We want to explore those comments and explain 1) Why they were hawkish and 2) What they mean for the Yellen/Trump relationship going forward.

Yellen’s Hawkish Point #1: It’s too Late For Fiscal Stimulus

Yellen was very explicit in the FOMC press conference in saying that large-scale fiscal stimulus was not needed now that the economy is basically at full employment, as it would risk igniting an acceleration in inflation (she is basically saying that fiscal stimulus now would do more harm than good, a direct contradiction to what the new administration is saying).

To understand her reasoning, imagine we’re trying to keep a fire going that’s almost gone out (the economy post 2008). To get the fire roaring again, we need kindling and wood (0% interest rates & QE) and a match (fiscal stimulus).

But, we don’t have any matches (there’s been no fiscal stimulus since ’08, and if anything, over regulation has inhibited growth). To keep the fire alive we keep heaping kindling (QE) and wood (0% rates) on top. And that partially works, and the fire doesn’t go out… but it doesn’t really grow, either (2% GDP growth since ’08).

Now we are left with a small fire, but a tower of wood and kindling above it that hasn’t caught on fire yet.

Then, after years of this we begin to see the fruits of our labor start to pay off as the lower logs are finally catching fire (full employment and an uptick in growth in 2016). Now we’ve got a fire that’s starting to grow, but we’ve got way too much wood and kindling on top of it, so we begin to remove the wood to make sure the fire doesn’t burn out of control (removing wood is equivalent to rate hikes).

Then, all of a sudden, someone comes along with a flame thrower (large-scale fiscal stimulus) and the risk is if they hit our tower of wood with this flame thrower before we can remove some of the logs, we’ll have an out of control inferno (surging inflation).

That’s basically the reasoning behind Yellen saying the economy doesn’t need large-scale fiscal stimulus right now (we needed it several years ago, before the theoretical tower of logs got too big). Now, I’m not saying I necessarily agree with that logic, nor am I endorsing it, but that is why she said what she did.

The reason this is a potential problem with Trump is because if Yellen stays on this message, then she is basically contradicting the administration and saying it’s doing the wrong thing economically.

And we all know how publicly criticizing Trump has gone over during the last 18 months—he yelled at the Pope, so I doubt Yellen is off limits!

Point being, there is the potential here for a very public disagreement, and that’s not good for investor sentiment or the markets.

Hawkish Point #2: The Fed Isn’t Trying to Overheat the Economy

As we stated last week, Yellen’s tone in this press conference was oddly defensive, and we can reasonably conclude it was in response to criticism of the Fed’s policies during the campaign season.

Specifically, Yellen very pointedly said the Fed was not trying to run the economy “hot,” i.e. keep rates lower than they should be solely to generate strong growth while ignoring the potential negative effects of inflation.

That comment was her rebuking Trump’s assertions that the Fed has 1) Kept rates too low to prop the economy up via the creation of asset bubbles, or 2) Kept rates too low to support growth so that Clinton could get elected. Again, this was surprisingly pointed, and the takeaway is clear. Yellen is aware of Trump’s criticisms, and apparently isn’t going to take them without response (although obviously never directly).

Bottom Line

Quite simply, I (and no one I’ve spoken to) remembers a time when a public spat between the president and the Fed chair was this likely to occur. That will have implications across assets: stocks, bonds, currencies (especially the dollar) and commodities (esp. gold and oil). And, this dynamic leaves us with some strange questions to ponder as we enter 2017:

  • Will Trump accuse the Fed of political motivation if they continue to hike rates, and if that hurts growth?
  • If the Fed hikes faster following fiscal stimulus, will Trump see it as undermining his economic plan, and will he then launch a Twitter attack?
  • Will Trump mock or belittle Yellen publicly?

Shocking as it may sound, these all are real questions that will likely be answered early in 2017, and we need to understand the implications of those answers if we’re to start 2017 off on the right foot.

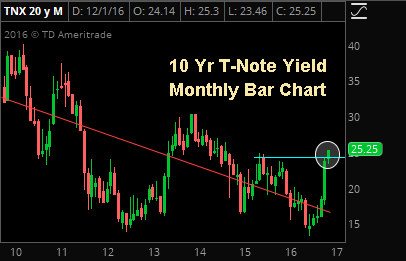
Again, all this matters for one specific reason: Interest Rates.

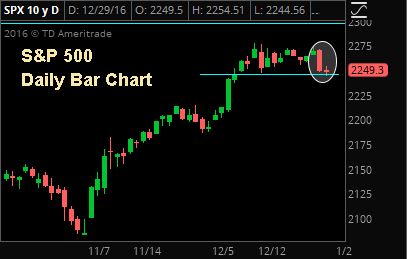
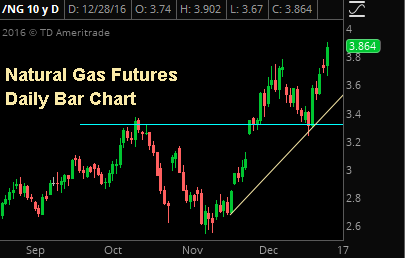
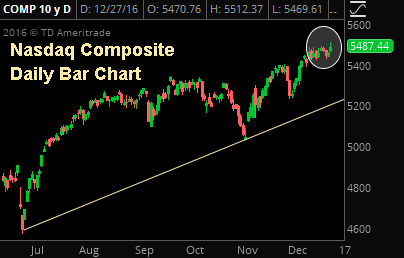
So far, stocks have weathered a huge spike in interest rates because markets expect economic growth to accelerate. But, rates keep rising at this pace, and the 10-year yield moves to and through 3% in Q1 2017, then that will have the potential to cause a potentially nasty pullback in stocks!

So, as we start 2017, make sure you’ve got an analyst team working for you who is focused on: Stocks, Bonds, the Dollar, Gold, Oil and Economic Data, because there will be volatility in 2017 (and potentially a lot).

We make sure our paid subscribers have the daily market intelligence and talking points across assets, so that they are never blindsided by a client question, and can turn any conversation into an opportunity to get a client.

And, we do it all just $195 per quarter ($65/month). It’s why we confidently believe we offer the best value in the independent research space.

I am so confident in the value our daily macro report provides that I’m continuing to extend a special offer to new subscribers of our full, daily report that we call our “2 week grace period.”

If you subscribe to The Sevens Report today, and after the first two weeks you are not completely satisfied, we will refund your first quarterly payment, in full, no questions asked.

To start your quarterly subscription, and see for yourself how The Sevens Report can help you grow your business, click here. 

Value Add Research That Can Help You Finish 2016 Strong and Start 2017 on the Right Foot!

Our subscribers have told us how our focus on medium-term, tactical opportunities and risks has helped them outperform for clients and grow their businesses.

We continue to get strong feedback that our report is: Providing value, helping our clients outperform markets, and helping them build their books:

Thanks for your continued insight; it has saved my clients over $2M USD this year… Keep up the great work!” – Top Producing FA from a National Brokerage Firm.

“Let me know if there is anything else that you need from us. Thanks again for everything. I really enjoy the Report – it is helping me grow my business and stay on top of things.” – Independent FA.

Great service from a great company!!” – FA from a National Brokerage Firm. 

“Great report. You’ve become invaluable to me, thanks for everything…! – FA from a Boutique Investment Management Firm. 

Subscriptions start at just $65 per month, billed quarterly, and with the option to cancel any time prior to the beginning of the next quarter, there’s simply no reason why you shouldn’t subscribe to The Sevens Report right now.

Begin your subscription now by clicking the button below to get redirected to our secure order form.

Finally, everything in business is a trade-off between capital and returns.

So, if you commit to an annual subscription, you get one month free, a savings of $65 dollars.  To sign up for an annual subscription, simply click here.

Best,
Tom

Tom Essaye,
Editor of The Sevens Report

Chart of the Day: More “Inside Prints”

spx-12-19-16

The S&P 500 printed its third “inside day” in a row yesterday which suggests a very indecisive market.  Generally speaking, the trend preceding any consolidation patter such as inside days, is more likely to continue than reverse out of the pattern.


Chart of the Day: Dow Weakness Ahead?

dji-12-15-16

The Dow Industrials showed signs of technical weakness in the form of a bearish “outside reversal” on Wednesday that could be forecasting a profit taking pullback in the index. A violation of 19,748 would be near-term bearish from a charting standpoint.


Chart of the Day: 10 Yr Yield Screams to New Multi-Year High

tnx-12-14-16

The 10 Year Note yield screamed to a more than 2 year high yesterday in response to the more hawkish than expected Fed Announcement.