The Contrarian Way to Make Money Off Rising Interest Rates

Good” vs. “Bad” Interest-Rate Increases & Why Inflation Is a Potential Value Play Right Now.

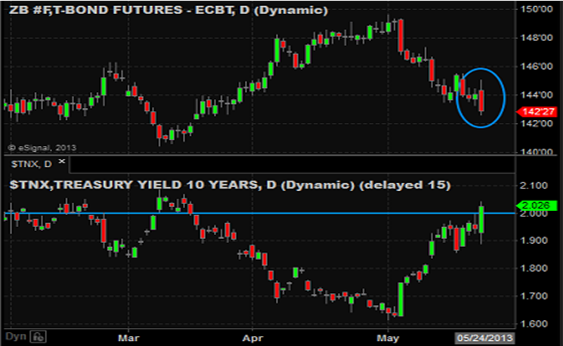
One of the points I’ve been trying to drive home about the recent increase in interest rates has not been so much the amount of increase, but rather the pace.

That’s because a slow, orderly rise in interest rates actually would be welcomed by the market.  This would be considered a “good” rise in interest rates because it would reflect expected improvement in the economy and the onset of some initial inflation—both of which are exactly what the Fed is trying to accomplish.

So, that type of interest-rate rise would actually validate the Fed’s policies.

The other type of interest-rate increase is a rapid, disorderly increase, which is the result of surging inflation expectations, worries about fiscal solvency, or a mass exodus of investors from the bond market in an effort to lock in profits.

That’s what we got a whiff of in Japan last week, and that’s why the market got spooked.

So, again, it’s the pace of interest-rate increases that matters, not the fact that they are rising.

So far, the market has embraced the increase in interest rates largely as the “good” kind.  Interest rates are rising because the outlook for the economy is improving and inflation expectations are starting to turn as the investment community gets more-comfortable with the idea of more-permanent economic growth.

If that plays out and we do experience the “good” type of interest-rate increases, then buying “inflation” is the value play in the market right now, because there is no inflation at the moment. But, if we are witnessing the “good” interest-rate increases, there will be inflation in the future.

So, keep an eye on inflation-linked assets like stocks generally (but again, avoid “yield-proxy” stocks), and specifically basic materials and hard-asset producers, which have lagged badly this year.

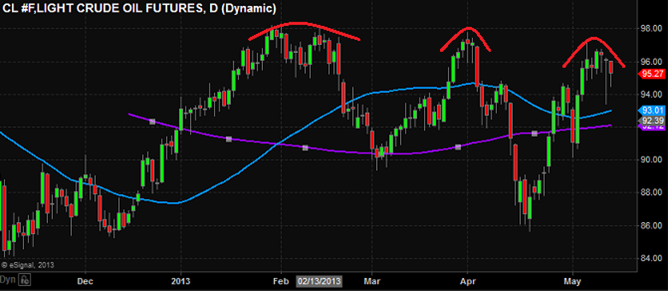
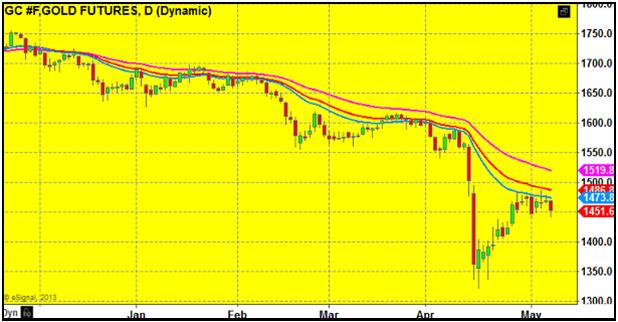
Also, gold, commodities generally, and land/real estate sectors will also outperform during a “good” increase in rates.

We aren’t there yet, so I wouldn’t be the hero and try to pile into beaten-down basic materials sectors or gold today.  But, keep an eye on them (or I’ll do it for you) as they are one sector where we could all generate some alpha if interest rates continue rise in a “good” way.

Japan’s Driving The Bus this Week – Here’s a Preview of What to Watch

Economics

Last Week

Last week was obviously all about the Fed, as Chairman Ben Bernanke’s testimony and the Federal Open Market Committee minutes were taken as “hawkish” by the market, which led to the Wednesday reversal and the first down week for stocks in five.

While pundits will debate the minutiae, the real takeaway from the Fed last week was that, on the margin, it seems more apt to taper QE rather than extend it. We can also conclude that, generally, Fed presidents are becoming a bit uncomfortable with the current program.

But, and this is the key, while the Fed is cautiously optimistic about the economy, its members want to see the improvement have some staying power, as they have been “faked out” by this economy a few times over the past several years.  As a result, they will err on the side of leaving the current QE program in place longer than they would like.

There are two takeaways then:  First, based on what we saw last week, we should expect “tapering” of QE to begin sometime in the September-to-December time frame, if the data continue to show improvement in the economy.  The Fed meeting on Sept. 18 is the date we should all circle as the first meeting where QE could potentially be tapered.

Second, the Fed is extremely data-dependent—as the data goes, so too will their decisions on when (and if) to actually taper the QE program.  So, economic data, especially jobs and inflation, are more important than usual this summer.

This Week

Domestically it’s a pretty quiet week, with the highlights being the jobless claims on Thursday and the monthly Personal Income and Outlays report Friday.

Jobless claims dropped last week and reversed about half of the surge we saw two weeks ago. Despite the volatility, the four-week moving average is still at a pretty low level (340k).  But, it’ll be important for markets to see the downtrend in claims resume, as the labor market is obviously important to the Fed.

Personal income and outlays is important not because of the spending numbers in the report, but more so because of the Personal Consumption Expenditure (PCE) price index, which is the Fed’s preferred measure of inflation.  Inflation is running low, and that has some at the Fed nervous about removing accommodation.

St. Louis Fed President James Bullard has been especially vocal about wanting to see inflation rise before “tapering” QE.  So, the PCE price index is important because, if it remains low, that may push back the date “tapering” begins.

Internationally it’s the same thing—the most-important factors in the short term are whether the European Central Bank will become more-accommodative and whether the Bank of Japan will continue its massive accommodation, add to it or even reduce it if Japanese bond yields continue to rise at the current pace.

So, while it’s a quiet week generally, the European Union’s HICP numbers Thursday (HICP is their measure of inflation) are key because inflation there is too low. Lower inflation implies a higher likelihood that we’ll see the ECB become more-accommodative over the coming months.

In Japan there is a lot of data this week (it’s by far the busiest region) with retail sales, Consumer Price Index, household spending and industrial production all hitting the tape. This data will show whether “Abe-nomics” is having the desired effect. Given the volatility we saw in Japan last week (in both the equity and bond markets) this data now takes on even more significance.

Don’t ignore Japan—last week it was a major influence on markets, and has the potential for a repeat performance this week.

Remember, this is all about central banks—and Japan currently is the one throwing its weight around the most.  If that appears to be changing or it looks like there’s instability in the Japanese markets, this will weigh on U.S. and European shares.


How Yesterday’s Sell Off Can Help You Outperform

Bottom Line

I believe there are two key takeaways from yesterday’s price action.

First, before markets reversed (while they were at record highs) I spoke to a colleague on a desk and he remarked how the most unbelievable thing about this rally isn’t so much the strong buy demand, but instead the total and complete lack of anyone booking any profits and selling at least part of their long positions.  There was simply nothing coming for sale.

Normally you make money doing the opposite of what the crowd is doing, so the fact that the market has marched higher like it has and no one is booking any profits tells me that’s probably the right thing to do (some profits, I’m not saying get out).   The S&P could rally another 20% from here (sentiment remains very skeptical and many people were asking if “this is it” yesterday, thinking this is the start to the inevitable correction).  But, yesterday’s “shot across the bow” reversal is a signal to put at least some money in your pocket. 

SevensReport_BondFutures_Chart

(Yesterday’s sell off was more about the bond market than most realize. 
When the 10 year yield broke through 2% and the 30 year Treasury moved to
new multi-week lows, the decline in stocks accelerated.)

Second, don’t ignore the fact that utilities badly underperformed and bonds sold off hard.  That tells me this is about the market starting to discount higher interest rates, and that may be the next big trend that can make us some money.  If you don’t have any positive exposure in your accounts to rising rates (either through bank stocks or inverse ETFs on the long bond) then start thinking about getting some, because the next big trend emerging may, finally, be of higher rates and lower bond prices.


To Taper or Not to Taper – that is the question, and Wednesday will be key.

Here’s the Need to Know This Week:

Last Week

The narrative surrounding the global economy didn’t really change all that much last week, despite the data being pretty disappointing.

Domestically, the spike higher in weekly claims to 360k was the biggest disappointment of last week, as the decline claims of the past month was one of the better things going in the economy.  Almost as disappointing were both the Empire Manufacturing and Philly Fed indices, which both turned negative. Again, these are watched because they are the first looks at May data—so they imply that regional manufacturing activity remains sluggish.  Even housing data was mixed this week, as starts missed expectations (although permits rose so call it a wash).  Finally, readings on inflation were also low, with year-over-year CPI coming in at 1.1%, well below the 2% Fed target.

Things weren’t much better internationally.  French, German and EU Q1’ 13 GDP all missed expectations, the German ZEW business sentiment index missed, and Chinese retail sales, fixed-asset investment and foreign direct investment all either met reduced expectations or were lower than estimates.

But, the takeaway is that none of that matters at this point.  The market isn’t really concerned about second-tier economic data (which all of last week’s reports were) and the only thing the market is focused on economically is the domestic jobs market and global PMIs, and specifically what effect those readings  will have on central bank’s policies.

But, the reason I’m pointing out this weak data is to make everyone aware that there are signs the economy is still not responding to central banks accommodation—so there remains no economic foundation on which the markets can rely  should central banks actually become less accommodative.  When that occurs, and despite the tapering talk it’s still a way off, we could see a bit of an air pocket in markets—so keep that in mind when thinking about positioning.

This Week

This week is all about Wednesday and Thursday morning.  As we know, the market is currently obsessed with WWFD (What Will the Fed Do) and we should get a lot more color on that this week.

First, and most importantly, Bernanke speaks before Congress at 10 a.m.  Multiple Fed presidents (including some doves) have recently expressed a desire to start “tapering” QE as soon as this summer.  But, this is still the chairman’s Fed, and the market will closely be watching his commentary to see if he is on board with the upstart movement to “taper” QE sooner than later.

Later Wednesday the Fed minutes from the most recent meeting will be released, and again the markets will be looking to see how extensive the discussion surrounding “tapering” QE was, and how many Fed presidents expressed “concern” about the potential negative effects of the current program.

Undoubtedly Bernanke will say during his testimony the Fed will remain data-dependent, so the third most important event this week will be the May flash PMIs, released Thursday morning (Chinese and EU flash PMIs will be released Wednesday night/early Thursday respectively).  Also Thursday morning, the weekly jobless claims will be monitored to see if the big jump we saw last week reverses itself (if it doesn’t, the market will take a lot more notice of it this week).

Finally, April durable goods are released Friday (although by that point people will be pretty exhausted and likely headed to the beach a bit early before the long weekend.

Did WTI Crude just put in a triple top?

Picture5

After a strong rally over the past several weeks, WTI Crude has stalled, and on the charts looks like it may have put in another “lower high” in the $96/bbl. area.  Generally most of the smart people I know in the energy patch are bulls and expect $100 to be taken out before too long, and I’m in no position to argue with them—but that chart pattern would make me a bit nervous if I were an energy bull.  A  break of $98 is needed to re-affirm the bullish trend.


WWFD (What Will Fed Do) is Now the Driving Force of Markets

Economics

Last Week

Last week was very quiet economically speaking, although what little data there was generally beat expectations. The majority of the data last week was internationally focused.

In Europe, the composite PMIs (manufacturing and service), German manufacturers orders, industrial production, and exports all were better than expectations.  The bottom line out of Europe last week was the data implied a slight uptick in economic growth, although most of the releases are pretty minor ones.  The fact that they were watched was more a result of the very quiet calendar, rather than for insight into the EU economy.

In China, trade balance beat estimates, although the export data looked somewhat suspect and people were generally discounting it.  The big print of the week, Chinese CPI, was a bit higher than expected, but PPI was lower so it was considered a wash.

There was only one notable release last week domestically and that was jobless claims, which again were positive and moved to new lows, implying continued incremental improvement in the labor market (claims are at their lowest level since January 2008).

The real focus last week, however, was on central banks, and specifically whether the Fed was more seriously considering tapering the current QE program than was generally believed.  Speculation on that caused stocks to stall late in the week and caused the U.S. dollar to surge higher.  Also, speculation is boiling over about what the ECB does next, and the growing expectation that they will “do more” was furthered last week by comments from various ECB officials.

This Week

There is more data this week than last, although it still shouldn’t be classified as a “busy” week.  Importantly, the market will likely trade more off central bank expectations than the absolute data itself, so we need to be looking at economic data through the prism of “what will it make the central bank do.”

Given that, we may be facing this perverse “good data is bad for the risk assets” situation as in the very short term the market seems a bit spooked by the Fed considering “tapering” QE.

In Europe it’s the same sort of thing, only the market has priced in, to a point, the expectation of the ECB doing “more.”  If the economic data is stronger than expected, then we might see the market react negatively.

In that vein, inflation data this week (CPI and HICP, which is the euro inflation index, both released Thursday) will be pretty important.  At this point, the Fed seems borderline dismissive of the dis-inflation creeping into the economy, but that may not be the case if CPI declines further.  So, a low CPI reading will be dovish (and probably positive for risk assets), while higher CPI will be hawkish.  In Europe, disinflation is seen as the main catalyst pushing the ECB to “do more,” so it the same thing—low HICP will be dovish while high HICP will be hawkish.

Elsewhere, retail sales (today) will be closely watched as the consumer lately has shown some signs of exhaustion due to higher payroll taxes and healthcare costs. Any further evidence of that trend won’t be welcomed by the market.  We also get our first look at May economic activity via the Empire and Philly Fed manufacturing surveys (Wed/Thurs).  Again these data points are important because the market is watching to see if the slowdown in growth in late March and April is merely temporary.

Other numbers to keep an eye on are industrial production (Wed) and another round of housing data kicks off Thursday with Housing Starts.  In Europe, this week looks pretty quiet, as industrial production and the German ZEW survey (both Tues) are the only releases to watch.

So, this week the market will be looking at the data in the context of:  1) Is the economic slowdown in the U.S.  only temporary, and is May data starting to pick back up and 2) What will the data mean for central bank’s propensity to reduce or expand accommodation.  Keep those two things in mind this week as the data is released.


Boring But Important: Junk Yields Sink Below 5%

Generally speaking, I consider something in a bubble when it meets three criteria:  First, there has to be some “game-changing event” that occurs that alters people’s behavior.  Second, a buying frenzy develops that pushes normal asset allocation practices out the window and prices to unreasonable levels.  Third, the fundamentally weakest part of the market sees massive inflows of investment and typical risk/reward relationships are ignored as greed sets in.

It’s no secret I think we’re in a bond bubble:  The Fed crushing rates to 0% and starting QE was the game-changing event that altered people’s behavior (the first criteria).  Treasurys have seen massive inflows at the expense of other assets, and given the fundamentals are now (most would admit) overvalued (the second criteria).  Finally, junk bonds are being bought with both hands, and yesterday the average yield on junk bonds fell below 5% for the first time ever, as yield-starved investors throw money into low-rated companies in an effort to generate income (the third criteria).

Some will justify the low yields based on the fact that investment grade bonds yields are also very low, and the spread between the two isn’t compressing substantially.  But, it is compressing, and if we use our common sense, we can see that risk isn’t being accurately priced at these absolute yield levels in junk bonds (a triple B– company is still just as risky on a ratings basis as it was when junk yields were higher).

Bubbles are all about the suspension of the proper pricing of risk—and I believe we’re seeing it in the junk market.    I’m not saying that junk bonds yields trading below 5% is akin to subprime loans trading where they were in the heights of the real estate bubble, but I’m just pointing out that, in my mind, all the criteria of a bubble have now been met by the bond market.

I don’t know when it’ll pop any better than anyone else—I just think it’s worth pointing out that the warning signs here are getting louder, and the “smart” money is quieting moving towards the door.  Food for thought.


Is the gold rally capped?

Picture5

Gold:  Since December of last year, the 23 & 30 day moving averages have capped any rally, and they look to be doing so again.  $1440 is critical support at this point.