Why the Yield Curve Matters to Your Clients
When you started in this business, did anyone sit you down and explain that watching things like the “10’s minus 2’s Spread” could help predict economic slowdowns and potentially avoid stock markets declines?
Me either.
I learned it the hard way – through being an execution trader and later a buy side portfolio manager through the mid – 2000’s, when in hindsight an inverted 10’s minus 2’s Spread provided a massive warning that a calamity was looming (the financial crisis).
Perhaps it’s just because of the scars from that period, but if you’re like me your blood pressure still goes up every time you hear “best” or “worst” since ‘07/’08.
So, my blood pressure is up considering I’ve heard it twice in the last week:
- Yesterday, the New Home Sales report posted the best number since January ’08.
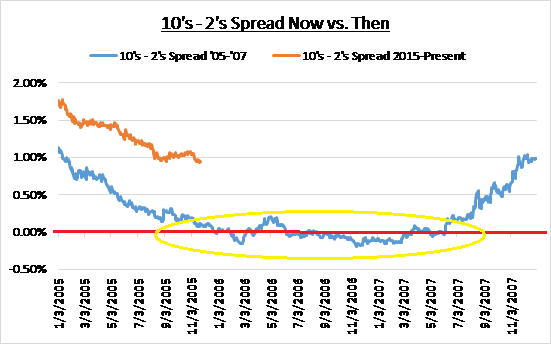
- Last week, as we and others pointed out, the 10’s minus 2’s Spread fell to its lowest level since last ’07.
Our primary mandate here at The Sevens Report is to make sure our subscribers never get blindsided by a macro-economic event, so that second statement concerns me a lot more than the first excites me, at least from a portfolio management standpoint.
We alerted subscribers to the 10’s – 2’s spread dropping to near 9 year lows last Monday (two full days ahead of the WSJ), and you, via these free excerpts Wednesday.
And, over the past week, I’ve had several discussions about the curve with colleagues, some of whom agreed with me about my concern, and some of whom tried to convince me that it is indeed different this time and the flattening curve is not a problem.
Yield curve dynamics are not in advisor trading programs, and the media doesn’t make it clear why the curve is important. So, I want to cover that quickly:
Myself and others watch the yield curve because it’s generally speaking a good, broad predictor of future economic activity. And, below I explain what the shifting yield curve says about future economic growth.
We watch all markets (including the bond market and the yield curve) so we can alert subscribers to the rising chance of a pullback before it happens.
That’s why we produce this Report at 7 AM every trading day, so that our paid subscribers are never blindsidedby a macro-economic surprise.
To that point, stocks are strong again today but there isn’t a real “reason” for this two-day rally, and it reeks of short covering and chasing, just like the previous failed rallies of the last three weeks.
Meanwhile, looking at fundamentals, the macro horizon is again filling with potential bearish influences:
- Chinese economic data missed estimates in April and worries about the Chinese recovery are rising.
- Complacency towards the Fed is as high as I’ve ever seen as markets simply do not believe anything the Fed says with regard to rate hikes, and that means another “Taper Tantrum” is possible between now and July (chances of a June rate hike are just 38%).
- Politics will once again become a force on the markets as the Brexit vote nears and the US Presidential Election gets closer.
- US economic growth needs to accelerate and while there’s not a risk of a recession, the first data points from May (Empire State Manufacturing, Philly Fed and Richmond Fed) started with a “thud.”
Bottom line, despite the S&P 500 again challenging 2100, I think the next two months will be more difficult than the last two months, and it will be harder for advisors to keep up on the shifting influences on this market.
That’s why we’re going to make sure we do that for our paid subscribers, because the most important thing for financial advisors to do for the rest of 2016 is show clients that they: 1) Know what is going on in markets, 2) Are in control of client portfolios, and 3) Know what to expect next.
Because if you don’t, you could lose those clients to someone who does.
We make sure our paid subscribers have an independent analyst team that communicates with them daily at 7 AM and quickly identifies the risks and opportunities for:
- Stocks
- Bonds
- Currencies
- Commodities, and
- Interprets what economic data means for the market.
The Sevens Report is the daily market cheat sheet our paying subscribers use to keep up on markets, seize opportunities, avoid risks and get more assets.
With a monthly cost of less than one client lunch, we firmly believe we offer the best value in the independent research space.
Understanding the signals the bond market is sending is very important for anyone managing money for the longer term, so we wanted to directly explain what shifts in the yield curve mean for the economy and stocks.
Why The Yield Curve Matters to Your Clients
There are three movements the yield curve can make: Steepening, Flattening, and Inverting. Each gives a different implication for future economic growth:
A Steepening Yield Curve (where long-term yields rise more quickly than short-term yields) is generally representative of an economy that’s seeing growth accelerate. The reason (broadly speaking) is because in a good economy, capital tends to leave bonds and flow into more cyclical assets that offer more upside like stocks. So, investors sell longer-dated bonds because they don’t want to be stuck in a long-term, low-yielding asset compared to other alternatives. Put simply, people don’t want to settle for getting a low-but-stable yield.
A Flattening Yield Curve occurs when the bond market fears an economic slowdown, investors flood into bonds as protection, sending long-term bonds sharply higher and yields lower, which then flattens the yield curve (it’s the inverse of the previous scenario, as investors flock to the safety of stable-but-low yields).
An Inverted Yield Curve occurs when investors are becoming so concerned about future economic growth that they are piling into longer term Treasuries to guarantee a return of capital, not a return on capital, and the yield on the 10-year Treasury Drops below the yield on the 2-year Treasury.
So, as a guide:
Steepening Yield Curve: 10-year Yields Rise Faster than 2-Year Yields = Expected Economic Acceleration.
Flattening Yield Curve (which we’ve had recently): 10-year Yields Drop faster than 2-Year Yields = Looming Economic Slowdown.
Inverted Yield Curve: The 10-year yield is less than a 2-year yield = Looming Recession or worse.
The yield curve inverted during the ’06 – ’07 period and forecasted the looming financial crisis.
The yield curve is flattening substantially right now, despite the broad expectation of higher economic growth, and it’s making me and other analysts nervous about coming months and quarters.

Bottom line, the flattening yield curve had our attention because historically it signals an economic slowdown, and if there is a slowdown looming, than that’s obviously a big problem for stocks going forward.
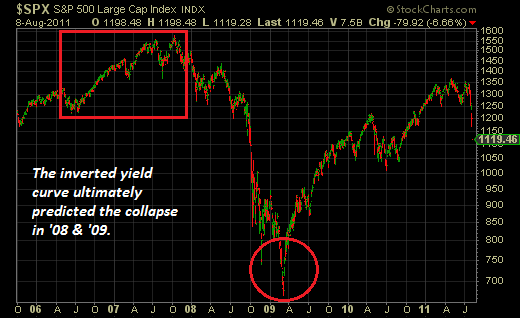
Finally, with regards to timing, when the yield curve inverted in 2006, it took a while for the stock market to break (again these are slower moving indicators), but advisors who ignored that warning and remained in “Risk On” mode enjoyed modest short term gains, but suffered massive losses in ‘08/’09.
Meanwhile, advisors with longer time frames, who heeded that warning sign, didn’t miss much upside, and likely avoided 60% drop in the S&P 500 in ‘08/’09.
That’s why we watch these indicators for our subscribers!
It’s Different This Time (2007 Edition).
Finally, in reference to, “It’s different this time,” (the idea that this flattening yield curve isn’t signaling a looming slowdown) I had to dust off some of my old notebooks, but just as a reference, when the yield curve last flattened and inverted in ’06/’07, everyone said, “It’s different this time.”
Back then, the reason cited was the massive global yen carry trade, where hedge funds were selling Japanese government bonds (which had a 0% yield) and taking that capital and dumping it into Treasuries, on a massively leveraged basis. That, theoretically, pushed down longer-dated Treasury yields in the midst of a mild Fed tightening cycle and that caused the yield curve to invert, (although it’s important to remember back then the 2-year yield was over 4%).
That was the reason it was different that time, but we all know that in the end, it wasn’t different at all (in hindsight, the yield curve was screaming an alarm bell well before the financial crisis).
I’m in no way saying we’re going to see a repeat of that this time, but I don’t believe it’s different this time, and if this yield curve continues to flatten I’ll take that as a continued warning sign.
Our paid subscribers know that they can rest easy because we are watching all asset classes for them, and we will alert them when one of them (like the yield curve) flashes “Caution” like it is now, and when that “Caution” becomes a “Warning.”
If your brokerage or paid research isn’t providing you this type of analysis on a daily basis, please consider a quarterly subscription to The Sevens Report. The monthly cost is less than one client lunch, there is no penalty to cancel, and our retention rate is over 90%.
Value Add Research That Can Help You Grow Your Business in 2016 (Despite the Tough Start)
Our subscribers have told us how our focus on medium term, tactical opportunities and risks has helped them outperform for clients and grow their books of business.
We continue to get strong feedback that our report is: Providing value, Helping our clients outperform markets, and Helping them build their business:
“Tom’s ability to summarize market action in minutes is invaluable in today’s environment of data overload. We spend over $100,000 a year on research, and The 7:00’s Report is the one piece of research I can’t do without.” – John S., Vice President of a multi-billion-dollar asset management firm.
“Great service from a great company!!” – FA from a National Brokerage Firm.
“Great report. You’ve become invaluable to me, thanks for everything…! – FA from a Boutique Investment Management Firm.
Best,
TomTom Essaye,
Editor of The 7:00’s Report

")


")
