Posts

An Economic Fork in the Road

What’s in Today’s Report:

  • Economic Breaker Panel Update: An Economy at a Fork in the Road

Global markets are trading with a moderate risk-off tone this morning as the trade war weighs on sentiment.

It remains unclear whether the U.S. will offer relief on existing tariffs as part of the “phase one” trade deal with China (which has been priced into stocks in recent weeks), or just cancel the scheduled December tariffs, which would be a disappointment.

Meanwhile, on the economic front, Eurozone Industrial Production was largely overlooked because of trade angst but the release was not as bad as feared (0.1% vs. E: -0.3%) further easing recession concerns in Europe.

There were other headlines overnight including escalating protests in Hong Kong which saw the Hang Seng underperform (down nearly 2%) and chatter about the public impeachment hearings in Washington today but neither are materially affecting U.S. stocks at this point as the market’s main focus remains the trade war.

Looking into today’s session, there is one economic report to watch: CPI (E: 0.3%) before focus will turn to Powell’s testimony before Congress on the state of the economy at 11:00 a.m. ET. Later in the day, there are two other Fed officials scheduled to speak before the closing bell: Barkin (12:30 p.m. ET) and Kashkari (1:30 p.m. ET).

Bottom line, there are a lot of headlines this morning but the trade war remains the single most important influence on this market so if expectations for tariff removal continue to fade, stocks are likely to trade with a heavy tone.

Why the Falling Yuan is Causing a Selloff

What’s in Today’s Report:

  • Why the Falling Yuan is Causing a Selloff
  • Weekly Market Preview
  • Weekly Economic Cheat Sheet

Futures and global markets are sharply lower as the U.S./China trade war intensified over the weekend.

China allowed the yuan to weaken below the psychologically important level of 7/dollar on Monday, signaling a likely acceptance of a long U.S./China trade war.

Economically, global July composite PMIs were better than feared and generally in-line with expectations, while the British services PMI easily beat estimates (51.4 vs. (E) 50.2).

Today, the key report is the ISM Non-Manufacturing PMI (E: 55.5) and the market will be looking for solid data.

Regarding U.S./China trade, undoubtedly there will be tweets flying today but there is a chance for some good news on U.S./China trade this week.  The Commerce Department may grant waivers for U.S. companies to do business with Huawei, and if that happens, it’ll help offset some of this recent trade escalation.

European Central Bank (ECB) Interest Rate Preview, September 6, 2017

Join hundreds of advisors from huge brokerage firms like Morgan Stanley, Merrill Lynch, Wells Fargo Advisors, Raymond James and more… see if The Sevens Report helps you make more money in less time with a free two-week trial.

The ECB is expected to signal it will begin to taper its QE program sometime in 2018 at tomorrow’s meeting; however, the details regarding that tapering announcement remain unclear.

Why It Matters: The dollar. The falling dollar, which is down more than 10% year to date, has been an under-appreciated tailwind on the stock market (a weaker dollar boosts exports and corporate profits). If the ECB is more hawkish than expected tomorrow, that will cause a potentially big reversal in the dollar. I say that, because “long euro/short dollar” is a very crowded trade at the moment, and if it reverses, it could be violent.

The reason this meeting will punch above its weight from a market standpoint is because the ECB commentary on tapering will be (correctly) taken as implicit commentary on the strength of the euro.

The market assumes that the ECB is not concerned about current euro strength. If the ECB fails to announce tapering intentions tomorrow, or is very vague about those intentions, the market will infer that the ECB thinks the euro is too high. If that happens, the euro will drop, hard, and the dollar will soar—and that will likely be a headwind on US stocks, and a (big) tailwind on European stocks (so HEDJ will begin to rally again).

Meeting Expectations If: ECB President Draghi confirms, at the press conference, that the ECB Governing Council intends to taper QE in 2018, and that it will reveal details of that plan at a future ECB meeting. So, Draghi announces tapering is coming, but doesn’t give any details.

Dovish If: Draghi does not announce the intention to being tapering QE sometime in 2018. This is a remote possibility, but given the strength in the euro I don’t want to completely rule it out.

Mildly Dovish If: Draghi announces that the ECB intends to taper QE, and that it will announce the details at the December meeting, at earliest. Draghi likely won’t single out December, but he won’t say details will be revealed at the “next” meeting, which would be October.

Hawkish If: Draghi announces that the ECB intends to taper QE, and says the details of the taper will be revealed at the “next” meeting. That’s the key phrase to watch for. If that’s the case, look for the euro to modestly rally as there is not clear consensus on an October reveal, and that would be taken to interpret urgency on the part of the ECB, and a disregard for the strength in the euro. It’s the latter point that would cause the euro to rally.

Finally, I don’t want to say that something is impossible, but it’s incredibly unlikely that Draghi and the ECB will reveal detailed plans regarding the tapering of QE tomorrow. The wide consensus will only be to announce they want to start tapering QE.

The Sevens Report is everything you need to know about the markets in your inbox by 7am, in 7 minutes or less. Start your free two-week trial today and see what a difference the Sevens Report can make.

China’s Inverted Yield Curve, June 28, 2017

If A Yield Curve Inverts In China, Does It Signal A Looming Recession?

The Sevens Report is the daily market cheat sheet our subscribers use to keep up on markets, seize opportunities, avoid risks and get more assets. Start your free trial today.

China's Inverted Yield Curve

Last week, in our post, “Will Chinese Credit Impulse Impact Global Markets?“, I explained how China remains the largest macro threat to the rally as it begins to deflate its massive credit bubble, a credit bubble that has funded asset bubbles across geographies (Australian property, California property, Treasuries, stocks, etc.).

At this point, it’s just a risk, as there are no concrete signs that the Chinese economy is in trouble, although the Chinese bond market is signaling some caution.

First, it’s well known that inverted yield curves predict recessions. Here in the US, the inverted yield curve predicted the ’81, ’91, and ’00 recession, and the ’08 financial crisis (remember the yield curve inverted in ’05, and stayed that way until the Fed started cutting rates in late ’07).

So, it is noteworthy that the Chinese government bond yield curve is essentially flat, and in some cases has inverted. For instance, as of yesterday the three-year government bond was yielding 3.558%, higher than the 5 year at 3.524%. And, the 7 year was yielding 3.626%, higher than the 10 year, which yielded 3.56%. So, while not a total inversion, it is safe to say it’s flat.

Now, before we go running for the hills and sell stocks, we have to realize this is China, not US Treasuries. As such, liquidity distorts this picture somewhat. For instance, 10-year Chinese bonds are by far the most liquid, so they will move more than other issues. Still, this is not the type of yield curve that implies an economy that is healthy. Again, this matters because the last time we got a Chinese economic scare, it caused the S&P 500 to collapse 10% in a few days… not once, but twice in a six-month period.

Bottom line, I’m not saying get defensive, but I am saying that from a macro standpoint 2H ’17 is shaping up to be more bumpy than 1H ’17, and I want everyone to be prepared. We will be watching China closely for you.

If you feel like at any moment this market could turn around – and in a hurry—subscribe to The Sevens Report. Get smarter, faster.

ECB Rate Decision, June 9, 2017

How to trade ECB Rate Decision—cut through the noise and understand what’s truly driving markets, as this new political and economic reality evolves. Start your free two-week trial today. 

The ECB Decision left rates unchanged, and made no changes to the QE program, as expected.

ecb rate decision

ECB Rate Decision Takeaway

The ECB met expectations Thursday, as they changed the risk assessment to “balanced,” and also removed the potential for lower interest rates going forward.

Overall, it was an anticlimactic meeting as the committee took another step towards the eventual end of QE, but gave no indication that the end of QE or rate hikes would occur sooner than was currently expected. As a result, the market largely yawned at the decision.

The euro dipped slightly on the news, despite it being a technical “hawkish” shift, and that’s because this result was already priced into the euro above 1.12. Thus, we saw a classic sell-the-news reaction.

Going forward, with the euro at current levels, whether the rally continues will depend more on US and EU economic data than anything else, as central bank policies for both the Fed and ECB are well known (the Fed should hike next week, and stick to the current guidance of three hikes for 2017).

From a bond standpoint, German bund yields dipped slightly following the statement, again a sell-the-news reaction. However, Treasury yields bounced slightly, mainly due to how short-term oversold they are. Bottom line, the ECB interest rate decision did not provide any sur-prises, and it will not cause Treasury yields to embark on a rally. Whether yields can rally from here will depend on economic data.

From an equity standpoint, I do not view this decision as negative for European stocks, and I remain bullish on European stocks via HEDJ and EZU. It’ll take a material uptick in US economic data for the euro to begin to weaken materially vs. the dollar over the next few months, but even if that doesn’t happen, the positive economic growth and continued QE should continue to put a tailwind behind EU stocks.

UK General Elections — What the Outcome Could Mean for US Markets, June 8, 2017

The focus on this event is magnified because of Brexit, but the bottom line is that it’s unlikely to move global markets. Still, I wanted to provide a basic primer so no one is blindsided if there is election-inspired volatility.

Today’s election will be for the House of Commons. Polls and most betting sites have the Conservatives (the Tories) holding an outright majority over the second-largest party, Labour.

Positive If: Conservatives increase their majority. Magic number: 330 seats. If the Conservatives win more than 330 seats, their majority should expand and it will give the Conservatives a clear mandate on Brexit negotiations, and on economic and monetary policy. Since markets like continuity, this is likely the most positive outcome for stocks near term (although to be clear, I don’t expect a big Tory victory to cause a legit global rally).

Neutral If: Conservatives hold an outright majority. Magic number: 325 seats (technically they need about 322 seats, as most people expect five seats in Parliament to remain vacant as they will be won by Sinn Féin in Northern Ireland, and they don’t exactly like to participate in British rule). This would be a step backwards, and make negotiating Brexit and implementing post-Brexit policy more difficult (but it wouldn’t be a bearish game changer for UK stocks).

Negative If: The Conservatives can’t secure an outright majority. Magic number: <322. This outcome would lead to a very weak majority government from either the Conservatives or Labour, and it would not be positive near term as there would be no mandate for Brexit negotiations or the implementation of economic policy. In this outcome (which is a low probability), the pound would likely get hit hard, as would UK stocks, although I don’t expect that it would be a global headwind beyond the very short term.

Cut through the noise and understand what’s truly driving markets, as this new political and economic reality evolves. Start your free two-week trial of The Sevens Report today.

OPEC (and NOPEC) Meeting Takeaways, May 26, 2017

Help your clients outperform markets with The Sevens Report. Get a free two-week trial—start today.

Oil trade over the last week was a classic case of “buy the rumor, sell the news,” as the speculative rally that carried WTI up to the $52 mark came completely unwound yesterday after OPEC announced that they would extend the cuts nine months, but not deepen them. WTI futures finished down a staggering 4.85% on the day.

The oil market ran higher this week into the meeting as expectations shifted from a six-month extension of current policy to a nine-month extension late last week. With that shift in expectations came a surge of speculative bets that if OPEC was willing to extend cuts longer, they might also be willing to deepen them.

OPECSo, a potential deeper cut began to get priced into the market amid the flurry of buying leading up to the meeting. Unfortunately for the bulls, it was just more of the same cuts through March 2018. The reason the market responded unfavorably to this outcome is pretty simple; the cuts haven’t worked so far, as global stockpiles remain near record highs.

Here is a quick refresher of the OPEC deal:

OPEC’s Goal: Higher oil prices.

OPEC’s Objective: Bring global stockpiles down from a record 3 billion bbls to the five-year average of 2.7 billion.

OPEC’s Task: Impose individual quotas totaling a production cut of -1.8M bbls (including Non-OPEC producers) from October 2016 levels to help the market rebalance.

OPEC’s Dilemma: Both Russia and Saudi Arabia want higher oil prices (as they always do), specifically because of upcoming elections and the Aramco IPO. But, with higher oil prices comes increased competition from US shale producers, who are ultimately taking market share from those imposing quotas overseas.

The bottom line here is that yesterday’s OPEC meeting was a disappointment to the market. Oil retraced all of the gains from the last week, as the market does not believe that “more of the same” is going to have a significant effect on stockpiles in the coming months… especially in the face of a nearly +600K bbls increase in US production so far in 2017. Looking into US fundamentals, there has been a slight, bullish shift in the data as oil inventories have been drawn down seven-straight weeks, and the pace of lower 48 production increases have moderated. But the data trend has been “less bearish” rather than outright bullish.

On the charts, there was a bearish, one-day reversal in both the active futures contracts as well as the notable calendar spreads. That’s a very bearish technical development with regard to the near term direction of oil.

While OPEC and their NOPEC friends say they are willing to “do all it takes” to support a balancing of the oil market, traders don’t believe them. The reason why is because if that were the case, they would have already cut production further. The fact that they’re hesitating to cut production shows that they are not willing to do all it takes, and that their main concern is with revenue.

Looking ahead, the single-biggest thing to watch remains US production. If US output continues to climb, it will not only offset cuts by overseas producers, it will increase OPEC angst about losing market share to the US. Recall that the rise of shale production is the reason OPEC crushed prices in 2014 with an “open spigot” policy. Looking ahead, nothing has changed with regard to OPEC member outlook on market share, which means every extra barrel being produced in the US increases the odds of cheating from cartel members.

Potential Medium-Term Bullish Catalysts:

1) Demand unexpectedly rises this summer amid economic growth and increased consumer spending (a big “if”), resulting in a decline in global stockpiles. It is worth noting that stocks are still pricing in strong growth, so this isn’t that big of a reach.

2) Geopolitics. If tensions rise with Russia, North Korea, or any Middle East nation, a flight to safety move into oil could push futures to new 2017 highs.

Potential Medium-Term Bearish Catalysts:

1) OPEC and NOPEC quota compliance falls. With every barrel of market share the cartel and friends forfeits to the US, the odds of compliance issues rise. If one producer begins to cheat, as Iraq apparently already has, then it will become much more likely that others will follow.

2) The trend of rising US production begins to accelerate again after moderating over the last few weeks. No matter how you spin it, rising US production is bearish for global oil prices, as it both offsets oil cuts by overseas producers and lowers morale among OPEC members because of the self-inflicted loss of market share that could induce cheating.

Join hundreds of advisors from huge brokerage firms like Morgan Stanley, Merrill Lynch, Wells Fargo Advisors, Raymond James and more… see if The Sevens Report is right for you with a free two-week trial.

Weekly Market Cheat Sheet, May 15, 2017

The Sevens Report is the daily markets cheat sheet our subscribers use to keep up on markets, leading indicators, seize opportunities, avoid risks and get more assets. Get a free two-week trial with no obligation, just tell us where to send it.

Last Week in Review:

Economic data last week was mixed in total, but from a market standpoint the takeaway was that it was neither strong enough to support a push through 2400 in the S&P 500, nor weak enough to generate any real selling. So, the net effect is that the market is left wondering whether the economic acceleration can continue, or whether we are losing momentum.

Retail Sales was the most important report last week, and while on the headline it appeared disappointing, a closer look revealed it was basically in line with expectations.

I say that, because while the headline missed estimates (0.4% vs. 0.6%) the revisions to the March data were positive, from -0.2% to 0.1%. Taken in aggregate, the two-month retail sales performance was slightly better than expected.

Looking at the more important “control” group, which is the best measure of discretionary consumer spending, it also appeared to be a disappointment, up just 0.2% vs. (E) 0.4%. But once again, the revisions were positive (from 0.5% to 0.7%), so if you take the two months together it was in line with estimates.

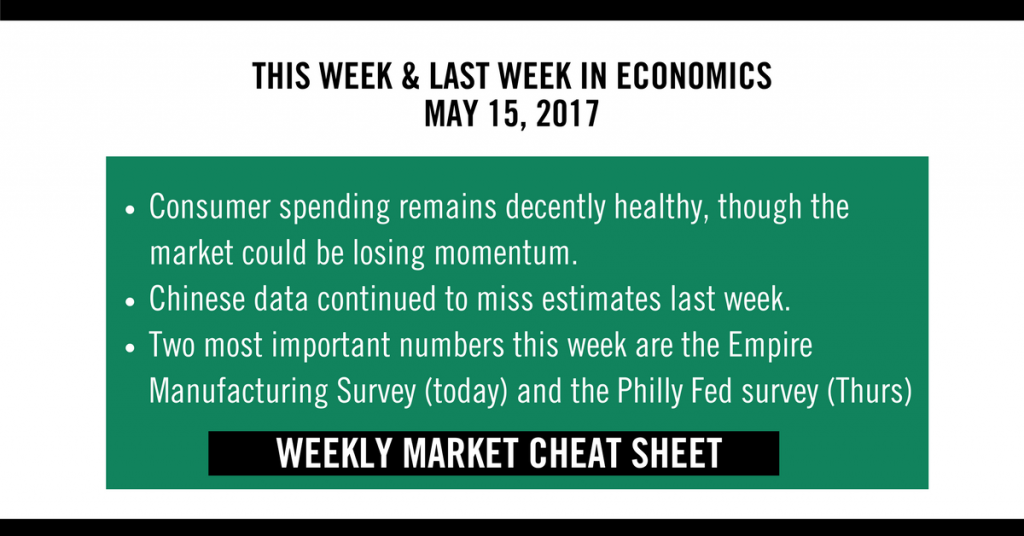
Bigger picture, consumer spending remains decently healthy, but activity isn’t on pace with Q3/Q4 of last year, when consumer spending powered economic growth. Without an acceleration in consumer spending, it’s hard to see the US economy accelerating materially from here.

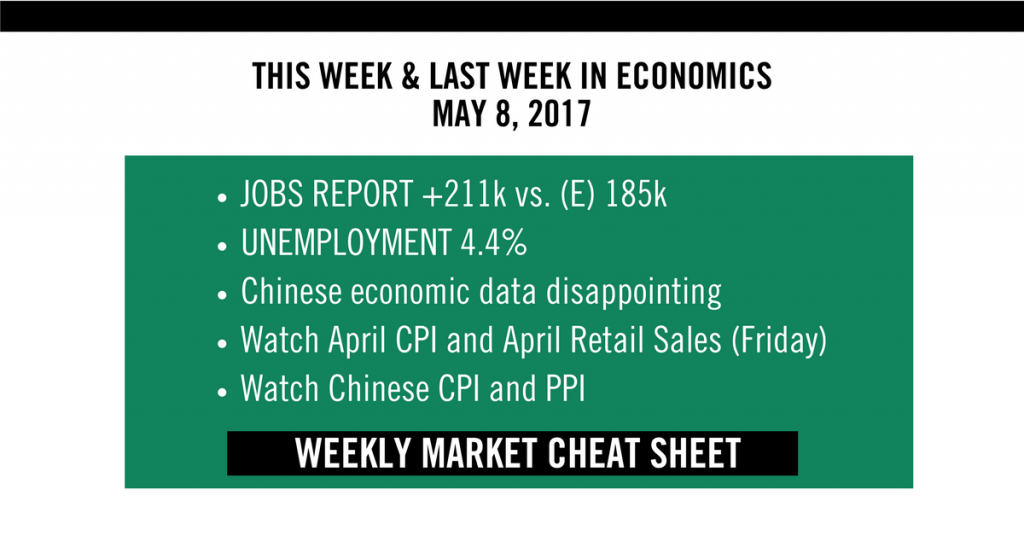
The other notable domestic numbers last week were the April CPI and PPI. The former was much-hotter-than-expected, as the core rose 0.7% vs. 0.2% on surging service inflation (financial services costs, especially). However, core CPI was slightly underwhelming, rising just 0.1% in April, and up 1.9% year over year, below the 2.0% estimate.

Bottom line, it’s a given that inflation pressures continue to build, but all the statistical data implies they are building very slowly. And given the Fed watches the statistical data, nothing in the inflation numbers will make the Fed think about hiking more aggressively or delaying the June rate hike.

The other notable data last week came from China, and it was on balance negative. April exports, imports, M2 money supply and PPI all missed estimates, although not by wide margins. Not all the data was bad, as new yuan loans were slightly better than expected. Then, this weekend, Fixed Asset Investment, Retail Sales and Industrial Production all slightly missed expectations.

Bottom line, legitimate doubts are creeping in about the state of the Chinese economy, but it’s simply too early for anyone other than Kyle Bass to declare a problem (he’s been warning about the implosion of China for years, and I’m sure one day he will be right. In the meantime, he has plenty of capital to wait it out). Yet for us, slowing Chinese growth remains a risk, but one that just needs to be monitored for now, which we are doing.

This Week’s Preview:

The calendar is once again relatively quiet this week, although we will get the first look at May data, which will help us decide whether the March/April lull in economic growth is ending.

To that point, the two most important numbers this week are the Empire Manufacturing Survey (today) and the Philly Fed survey (Thursday). Both give us our first look at May economic activity, and while both are just regional surveys, they still matter given the seemingly precarious trend in economic data (is it the pause that refreshes, or are we losing momentum?).

Outside of those two manufacturing surveys, April Industrial Production comes Tuesday, and that will give us another hard-data look at manufacturing activity. Remember, while manufacturing PMIs soared in early 2017, actual hard data hasn’t really moved (hence the gap between soft sentiment indicators and hard data). So, it’ll be an economic positive if Industrial Production can show an acceleration in manufacturing activity.

Outside of those reports, the only other notable numbers are housing related, as we get the first look at April home sales numbers. The Housing Market Index comes today, Housing Starts come tomorrow. Sentiment towards housing is pretty buoyant right now, so it’d be unlikely (and a big surprise) if we saw a housing roll over.

Bottom line, this week will shed some incremental light on the current state of economic growth, and given the markets are starving for a catalyst (positive or negative) usually inconsequential numbers may indeed move stocks.

Get the simple talking points you need to strengthen your client relationships with the Sevens Report. Everything you need to know about the markets delivered to your inbox by 7am each morning, in 7 minutes or less. 

Weekly Market Cheat Sheet: May 8, 2017

The Sevens Report is the daily markets cheat sheet our subscribers use to keep up on markets, leading indicators, seize opportunities, avoid risks and get more assets. Get a free two-week trial—no obligation, just tell us where to send it.

Weekly Market Cheat Sheet

Last Week in Review:

Economic data last week, highlighted by the strong jobs report, helped to somewhat narrow the gap between soft sentiment surveys and hard economic data… although it’s fair to say that gap remains open and is still a headwind on stocks, just a slightly less strong one. It was not all positive last week, though, as we got several signs of potential loss of momentum in China, which was an underreported but potentially important development last week. Finally, the Fed meeting proved to be a non-event, except in that it reaffirmed a June rate hike is likely (but that’s already mostly expected from the markets).

Starting with the jobs report, it met our “just right” scenario. The overall job adds were strong at 211k vs. (E) 185k, but revisions to the March report were negative 19k, so the net number was more in line. The unemployment rate dropped to 4.4%, but that was in part due to a decline in the participation rate. Meanwhile, year-over-year wage increases declined to 2.5% from 2.7%. Bottom line, this number was “fine,” but it wasn’t massively reflationary (in part due to the wage number) and that’s why we didn’t see the strong headline jobs report ignite an immediate reflation rally in stocks (again, the wage number undermined the strong job adds).

Looking at other economic data last week, there were more positives than negatives, highlighted by the ISM Non-Manufacturing PMI, which hit 57.5 vs. (E) 55.8. That strong Non-Manufacturing PMI helped to offset the soft April Manufacturing PMI, which dipped to 54.8 vs. (E) 56.5 while the New Order component dropped below 60 for the first time in five months. While disappointing vs. expectations, it’s important to remember that the absolute level activity remains strong.

Turning to the Fed, the key takeaway from last week’s Fed meeting was that the Fed viewed the loss of economic momentum in Q1 as “transitory,” and still said risks to growth were “roughly balanced.” Both terms are Fed speak for, “We’re going to hike in June despite the soft Q1 GDP.” The market largely expects that (Fed Fund futures have a hike priced at 83% (which is close to a universal conclusion).

Finally, I want to take a moment and focus on Chinese economic data from last week, as the numbers were universally disappointing. Official April Manufacturing PMI dropped to 51.2 vs. (E) 51.7 while composite PMI declined to 51.2 vs. previous 52.1. Additionally, iron ore went into quasi freefall this week, as iron ore futures ended limit down on the Dalian Commodities Exchange on Wednesday night. The drop came after the Chinese steel industry PMI dropped below 50, signaling contraction. Oversupply has something to do with the price drop as well (exports are surging out of Australia) but the bottom line is that base metal prices are a coincident indicator of economic activity. The declines in iron ore, steel and copper last week, combined with the under-whelming Chinese data, definitely caught our attention. We now are officially watching this closely for everyone, and will keep you updated.

This Week’s Cheat Sheet:

This week, April CPI and April Retail Sales (both Friday) are the important reports to watch. The latter is more important for markets at this point than the former, as we need to see a rebound from Q1’s paltry consumer spending. If retail sales fail to show progress and beat expectations, it’ll widen the gap between soft data and hard economic numbers. With CPI, we should see some mild cooling of the recent uptick in inflation, but overall inflation pressures continue to slowly build.

Outside of those two numbers, focus will be on the Chinese CPI and PPI, as again data there suddenly turned lower last week. Bottom line, it should be a quiet week, but retail sales and CPI are important as the “gap” between soft sentiment surveys and hard economic data remains… and it needs to close further if we are going to see a breakout in stocks.

Get the simple talking points you need to strengthen your client relationships with the Sevens Report. Everything you need to know about the markets delivered to your inbox by 7am each morning, in 7 minutes or less. 

Last Week and This Week in Economics, May 1, 2017

The Sevens Report is everything you need to know about the markets by 7am each morning in seven minutes or less. Free trial at 7sReport.com.

Economic data continued to underwhelm last week and the gap between soft sentiment surveys and actual, hard economic data remains wide, and that gap remains a medium term risk on the markets.

The Sevens Report - This week and last week

Last week in Economics – 4.24.17

Looking at the headliner from last week, Q1 GDP, it was underwhelming, as expected. Headline GDP was just 0.7% vs. (E) 1.1%, and consumer spending (known as Personal Consumption Expenditures or PCE) rose a mea-sly 0.3%. But, the 0.7% headline met the soft whisper number and that’s why stocks didn’t fall hard on Friday.

That GDP report came on the heels of another underwhelming Durable Goods number. The headline missed estimates but the more importantly, New Orders for Non-Defense Capital Goods ex-Aircraft rose just 0.2% vs. (E) 0.4%, although revisions to the February data were positive.

Meanwhile, inflation metrics firmed up last week. First, the PCE Price Index in Friday’s GDP report rose 2.2% vs. (E) 2.0%, while the Employment Cost Index, a quarterly gauge of compensation expenses, rose 0.8% in Q1 vs. (E) 0.4%. Those higher inflation readings were why you saw the dollar rally pre-open Friday despite the disappointing GDP report.

Bottom line, the economic data over the past several weeks hasn’t been “bad” and it’s not like anyone is worried about a recession. But, the pace of gains has clearly slowed, and until we see a resumption of the economic acceleration many analysts were expecting at the start of 2017, any material stock rally from here will not be economically or fundamentally supported (and remember, it was the turn in economic data back in August/September that ignited the late 2016 rally. Yes, the election helped, but the momentum was positive before that event, so economics do matter).

This Week in Economics – 5.1.17

Economic data this week could go a long way towards helping to resolve the large gap between soft sentiment surveys and hard economic data, given the large volume of economic reports looming this week.

First, it’s jobs week, so we get the ADP Employment Report on Wednesday and the official jobs report on Friday. We’ll do our typical “Goldilocks Jobs Report Preview” on Thursday, but after March’s disappointing jobs number, the risks to this report are more balanced (it could easily be too hot if the number is strong and there are positive revisions, or it could be too cold and further fuel worries about the pace of growth).

Second in importance this week is the Fed meeting on Wednesday. The reason this is second in importance is because it’s widely assumed the Fed won’t hike rates at this meeting (June is the next most likely date for a rate hike), although the Fed has turned slightly more hawkish so there’s always the possibility. We’ll send our FOMC Preview in Wednesday’s report but the wildcard for this meeting is whether the Fed gives us any more color into how it plans to reduce its balance sheet. If the Fed does reference or start to explain how its plans to reduce its balance sheet, that could be a hawkish surprise for markets.

Finally, we get the global manufacturing and composite PMIs this week. Most of Europe is closed today for May Day so just the US ISM Manufacturing PMI comes today, with the European and Japanese numbers out tomorrow. Then, on Wednesday, we get the US Service Sector PMI and global composite PMIs on Thursday. The global numbers should be fine but the focus will be on the US data. In March we saw a loss of positive momentum in these indices but the absolute levels of activity remained healthy. If we see more moderation and declines in the ISM Manufacturing and Non-Manufacturing PMIs in April, that will stoke worries about the overall pace of growth in the economy and that will be a headwind on stocks.

Bottom line, this a pretty pivotal week for the markets. On one hand, if economic data is strong and the Fed a non-event, the S&P 500 could push and potentially break-through 2400. Conversely, if economic data is underwhelming and the Fed mildly hawkish, we could easily see last week’s earnings/French election rally given back, and the S&P 500 could fall back into the middle of the 2300-2400 two months long trading range.

The Sevens Report is your weekly cheat sheet. Get a free two-week trial: 7sReport.com.